
Article
Process analysis: How to map and improve business processes


In an increasingly competitive, technology- and customer-oriented business environment, understanding and optimizing how work is performed has become a strategic necessity. Organizations face constant pressure to improve efficiency, reduce costs, accelerate response times, and deliver consistent experiences. To meet these challenges, process analysis plays a central role in enabling the understanding and optimization of workflows.
This article provides a comprehensive overview of business process analysis, from its definition and importance to the key methodologies used, such as SIPOC, Process Mapping, flowcharts, and Value Stream Analysis. It also explains how these tools complement each other, when they should be applied, and how they contribute to improving different types of processes.
The goal is to provide a reference to help leaders and teams analyze, redesign, and improve processes, creating more efficient, agile, and customer-centric operations.
What is process analysis?
Process analysis is one of the fundamental pillars of continuous improvement and Lean operations management. Before diving into the methodologies and tools commonly used, it’s essential to understand what it truly means to analyze a process, and why this practice has become indispensable for organizations.
Definition of process analysis
Process analysis is a structured approach used to understand how work is performed by identifying each activity, workflow, responsible party, and resulting outcome. Its purpose is to gain a clear, factual, and detailed view of how processes actually work, helping to uncover inefficiencies, redundancies, failure points, and concrete improvement opportunities. It is an essential practice for any organization aiming to implement operational excellence principles.
Why process analysis is essential in modern organizations
In a context shaped by increased competitive pressure, the need for agility, and rising customer demands, understanding internal processes has become a critical advantage. Process analysis enables organizations to:
- Increase operational efficiency by eliminating unnecessary or poorly designed activities.
- Improve the customer experience by ensuring fast, simple, and consistent workflows.
- Facilitate digital transformation by clarifying functional and automatable requirements.
- Reduce costs by eliminating waste and optimizing resource usage.
- Standardize and stabilize operations to ensure predictability and reduce variability.
- Foster a culture of continuous improvement by involving teams in identifying and solving problems.
Process analysis is a catalyst for strategic decision-making and for creating a more robust and customer-oriented organization.
Discover how process analysis can transform your organization
Process analysis tools
There are several tools for analyzing and mapping processes, each serving a distinct purpose depending on the level of detail required and the analysis’s goal. Understanding these differences is key to selecting the most appropriate approach. The main process analysis methods include:
- SIPOC provides a high-level view of processes, focusing on the relationship between suppliers, inputs, process, outputs, and clients.
- Process Mapping offers a mid-level of detail, illustrating the steps involved and who is responsible for each one.
- Flowchart dives deeper into the process, highlighting specific tasks, decision points, exceptions, and the exact sequence of actions that make up the process.
- Value Stream Analysis (VSA) goes beyond the process by visualizing material and information flows across the entire value chain.
Choosing the right tool depends on the required depth and the type of process being analyzed. Since each methodology has its own approach, the steps involved in process analysis vary accordingly. Below, we explore each methodology and when they should be applied.
SIPOC: high-level view
SIPOC is a simple yet highly effective tool for obtaining a macro-level view of a process. It quickly clarifies who supplies what, how the process transforms inputs into outputs, and who receives the results. This tool is especially useful at the beginning of any process analysis, as it helps align teams and build a shared understanding before delving into detail.
Meaning of SIPOC:
- Suppliers: Entities providing the necessary inputs for the process.
- Inputs: Resources, raw materials, data, or information feeding the process.
- Process: A set of main activities or steps that transform inputs into outputs.
- Outputs: Final results (products, services, or information).
- Customers: Recipients of the outputs.
The SIPOC diagram should be constructed in workshops with multidisciplinary teams, ensuring diverse perspectives and the involvement of key stakeholders.
It is recommended to follow a structured sequence:
- Define the outputs (products, services, or information resulting from the process).
- Identify the customers of those outputs (internal or external).
- Link customers to outputs.
- Identify the process (activities that transform inputs into outputs).
- Connect the process to the outputs.
- List the inputs (resources, raw materials, documents, or data required for the process to function).
- Link inputs to the process.
- Identify the suppliers (internal or external).
- Map the relationships between suppliers and inputs.

Figure 1 – Example of a typical SIPOC structure
Following this sequence allows you to create a complete SIPOC that is clear and aligned with operational reality, serving as a solid basis for more detailed subsequent analyses.
Process Mapping: Understanding the sequence of activities
Process Mapping visually represents the steps within a process, who performs them, how they relate to one another, and the time required for each. This tool offers an intermediate level of detail, sufficient to reveal inefficiencies, but without going into the granularity of a flowchart.
It should be developed collaboratively, ideally in a workshop combining the perspectives of different stakeholders. To ensure consistency and depth, it is recommended to follow a structured sequence:
- Select the process to be analyzed: Choose one that significantly impacts the business or the customer.
- Define the process: Clearly mark the boundaries where the process starts and ends to ensure a shared understanding.
- Gather data on the current process: Collect factual data such as frequency, error rates, time per step, number of people involved, cost, customer satisfaction, etc.
- Define a clear goal for improvement: Define which indicators need improvement (e.g., lead time, error rate, workload, cost).
- Map the process – current state: Visually represent each step, including who does what, in what sequence, with what information, and using which tools.
- Capture processing time and lead time: Quantify time spent per step and the total duration of the process. Comparing the two reveals inefficiencies and waiting times.
- Identify improvement opportunities: Look for recurring errors, poorly defined interfaces, rework, waiting times, and bottlenecks.
- Assess improvement potential: Group and prioritize opportunities based on impact and ease of implementation.
- Select ideas for improvement: Use brainstorming to generate and choose solutions.
- Map the process – future state: Design a new process map that eliminates identified waste and incorporates the improvements.
- Develop an action plan: Define what will be done, by whom, by when, and with which resources.
- Verify the implementation of the solution: Monitor execution, validate results, standardize the new process, and ensure all teams are trained on the new flow.

Figure 2 – Example of a typical Process Mapping structure
When applied in a structured, collaborative way, Process Mapping becomes a catalyst for continuous improvement, transforming complex processes into simple, efficient, and customer-oriented flows.
Process flowchart: Represent the flow of activities in detail
A process flowchart is a visual tool that describes all tasks in a process with high-level detail, highlighting their logical sequence. By increasing the level of granularity of activities, flowcharts allow you to identify exceptions, decision points, unwanted returns, and variations that are not visible in higher-level representations. They are especially useful for standardization, internal audits, and team training.
Their construction should be collaborative and based on direct observation of the actual work. To ensure consistency, it is recommended to follow four main steps:
- Define the process: Clearly establish where the process starts and ends.
- Document every step in order: Gather information on all tasks that occur between the beginning and end of the process and represent them sequentially, from top to bottom, using the standardized symbols of this methodology.
- Add arrows to define the flow: Use arrows to show the flow direction, especially at decision points.
- Identify improvement opportunities: Critically analyze the process to identify areas for improvement.
- Design the future-state flow: Create an improved version of the process, removing waste and integrating improvements.
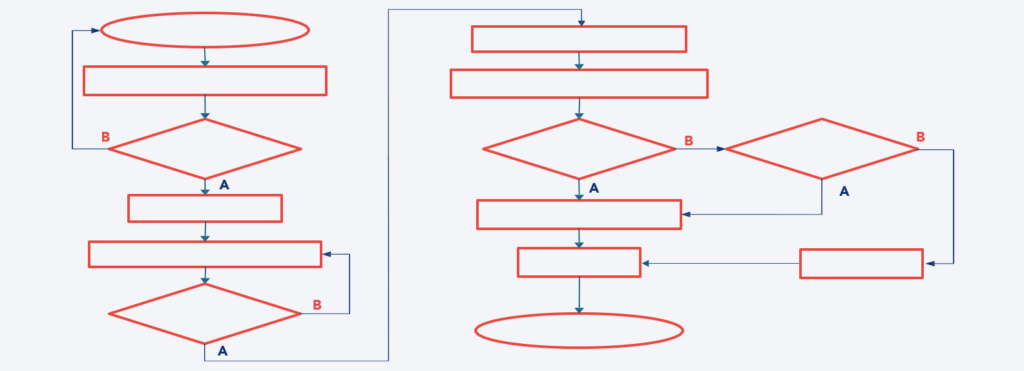
Figure 3 – Example of a typical flowchart structure
By making every detail of the workflow visible, the process flowchart becomes an essential tool for understanding the actual process and laying the groundwork for simplifying and improving it through continuous improvement initiatives.
Value Stream Analysis: Identifying waste and improving flow
Value Stream Analysis (VSA) is a powerful tool for examining end-to-end value chains. VSA reveals the flow of materials and information and its impact on lead time throughout the value stream.
An effective VSA combines technical analysis with direct observation at the Gemba (the actual place where work happens), real operational data, and the active involvement of a cross-functional team. To ensure consistent and impactful results, the following structured approach is recommended:
- Collect preliminary data: Before the workshop, gather key data to build a factual Foundation.
- Current-state analysis (Value Stream Mapping): At the Gemba, map the material flow starting from the end of the process using standard forms and symbols; consolidate this data into a visual map using post-its in the workshop and complement it with information flow mapping.
- Kaizen tool training: Equip the team with Lean Kaizen tools to ensure they have the knowledge needed to redesign the process.
- Identify improvement opportunities: Use the waste observed and new flow paradigms to find areas for improvement.
- Future-state design (Value Stream Design): Build the future-state map, ensuring continuous flow with minimal waste.
- Cost-benefit analysis: Evaluate required investments and projected operational and financial gains.
- Implementation plan: Develop a step-by-step roadmap to transition from the current to the future state, typically through Kaizen Events.
- Presentation and alignment: Share the results, future-state map, and implementation plan with all stakeholders to ensure alignment and commitment.

Figure 4 – Example of a typical VSA structure: initial state map

Figure 5 – Example of a typical VSA structure: future-state map
By making the end-to-end value stream visible, the Value Stream Analysis exercise provides the clarity needed to eliminate waste, reduce lead time, and build truly customer-oriented processes.
Other process analysis methodologies
In addition to the business process mapping tools discussed, other methodologies allow organizations to examine processes from different perspectives. These include:
- Customer experience map: Focuses on the customer’s interactions, perceptions, and emotions throughout their journey—helping identify needs, friction points, and opportunities to improve the experience.
- Service blueprint: Maps service delivery from the customer’s perspective and separates front-office and back-office activities, showing how internal operations directly impact the customer experience.
- Swimlane Diagram: Organizes activities by function or department to clarify roles, reveal communication breakdowns, inefficient handoffs, and cross-functional rework.
- Process Mining: Uses actual system data to automatically reconstruct the process flow, identify variations, and uncover issues that may go unnoticed in manual analysis.
These methodologies expand organizational visibility by allowing teams to analyze processes as interconnected sequences of tasks, experiences, responsibilities, systems, and information flows.
Process analysis examples
Process analysis can be applied to any type of operation, from administrative tasks to industrial workflows or customer-facing activities. In an administrative context, the combination of SIPOC and Process Mapping is often the most effective approach. SIPOC helps identify and frame the most relevant processes for the organization, and then Process Mapping reveals redundant steps, prolonged waiting times, and a lack of standardization, facilitating the simplification of activities and the improvement of quality, cost, and service indicators.
For process optimization in the industry, Value Stream Mapping is the most commonly used approach, as it allows for the visualization of waste both in material flows and information flows. This analysis highlights issues such as excess inventory, unnecessary movements, delays, and production planning problems, enabling the redesign of the flow to reduce lead time and increase productivity. It is an essential methodology for achieving excellence in industrial operations.
In customer service processes, methodologies such as the Customer Experience Map or the Service Blueprint help identify friction points, improve interaction flow, and make the service more consistent and customer-oriented. These tools are crucial for improving service quality and aligning it with customer needs.
The most important thing is to select the appropriate methodology for each situation, ensuring that the chosen tool provides the necessary level of detail, perspective, and depth to understand the process and effectively guide improvement.
Get expert support to improve your processes
Process analysis in a continuous improvement culture
In an organization aiming to implement a culture of continuous improvement and a Kaizen approach to operations, process optimization should no longer be a one-off initiative but should be systematically integrated into the organization’s improvement practices. The methodologies presented (SIPOC, Process Mapping, Flowcharting, VSA, and other complementary approaches) can be applied both by natural teams within the scope of Daily Kaizen and by cross-functional teams through Kaizen Cycles focused on transversal processes.
In the context of Daily Kaizen, teams should regularly analyze the processes they are responsible for, identify problems, propose countermeasures, and continuously stabilize improvements. This mechanism reinforces standardization, promotes systematic learning, and ensures positive performance evolution.
On the other hand, process analysis conducted within Kaizen Cycles with cross-functional teams is essential for improving processes spanning multiple areas and requiring a deeper redesign of value streams. These initiatives allow for the elimination of structural waste, reduction of lead time, improvement of departmental interfaces, and overall process performance enhancement.
It is the leaders’ responsibility to create an environment that fosters process optimization by ensuring alignment and cooperation between teams, removing organizational barriers, providing necessary resources, and ensuring consistent application of methodologies. When these practices are embedded into daily management, the organization develops the ability to improve continuously, becoming more agile, efficient, and customer-oriented.
Still have some questions about process analysis tools?
When should I use SIPOC, Process Mapping, flowcharting, or VSA?
SIPOC should be used when a macro and quick view of the process is needed. Process Mapping is suitable when it is necessary to understand the sequence of activities, responsibilities, and times. As for the Flowchart, it should be applied when a higher level of detail is required regarding tasks, decisions, and exceptions. Finally, Value Stream Analysis is indicated when the goal is to analyze the complete flow of materials and information, identify waste, and reduce lead time.
How do I know if a process needs to be analyzed and redesigned?
A process should be analyzed when it presents delays, errors, or rework, when it generates customer dissatisfaction, when it shows bottlenecks or waste, when costs are high, or when it faces difficulties in being automated or functioning consistently.
See more on Operations
Find out more about improving this business area