
Article
Build the KPI Tree — Baseline performance in 48 hours


This article is Part 2/6 of the series: The 90-Day Operational Excellence Blueprint. Part 1/6: “Find the Constraint — The 60-Minute Operational Diagnostic” covered how to identify where performance is breaking down and locate the single constraint that limits the entire system. This article translates that diagnostic output into a KPI tree and an actionable performance baseline established in 48 hours.
Although most organizations have visibility of their performance gaps, they lack the structural logic to explain what drives them.
Although dashboards are full and reports are produced on schedule, when a target is missed or a process breaks down, no one can confidently trace the problem back to its origin. The data exists, but the connecting logic does not.
This is the gap that a KPI tree closes, not by adding more metrics, but by creating a structure that makes the causal relationship between operational behavior and strategic outcomes visible, hierarchical, and accountable.
This article explains what a KPI tree is, how to build one using the output of an operational diagnostic, and how to use it to establish a credible Performance Measurement System (PMS) in 48 hours.
What is a KPI Tree?
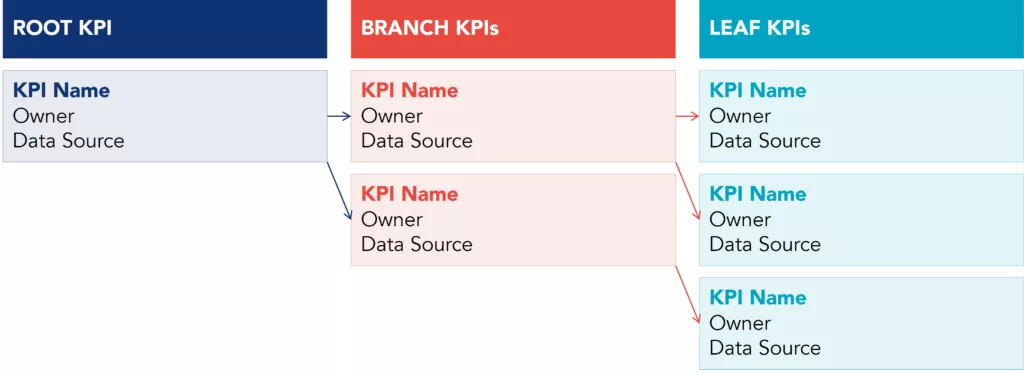
A KPI tree is a hierarchical representation of performance metrics that shows how leaf KPIs at the operational level drive branch KPIs at the tactical level, which in turn drive the root KPI at the strategic level. It is also referred to as a driver tree or metrics tree.
At its core, it answers one question: What needs to be true at the process level for the strategic goal to be achieved?
The structure has three levels:
- Root KPI: the North Star metric or primary strategic objective. This sits at the top of the tree and defines what the organization is ultimately optimizing: throughput, revenue, cost per unit, on-time delivery, or another business goal.
- Branch KPIs: the tactical outcomes and drivers that directly influence the root KPI. These are intermediate results that operations teams can observe and influence on a weekly or monthly cadence.
- Leaf KPIs: the operational inputs and process indicators that frontline teams control daily. Cycle times, defect rates, schedule adherence, first-pass yield, unplanned downtime; the operational inputs that teams control directly.
The logic runs in both directions. Read top-down, the tree describes the operational conditions that must hold for strategic objective targets to be met. Read bottom-up, it shows how daily process decisions compound into business goals.
That bidirectional logic is what makes KPI trees a foundational instrument in performance management: they do not merely track outcomes, but provide the causal structure needed to explain them.
Why most measurement systems fail
Understanding why conventional measurement approaches break down is a prerequisite for building something better.
The most common failure is metric proliferation: Each department adds its own indicators over time, each project introduces new ones, and legacy dashboards accumulate without ever being cleaned up. The result is no shared agreement on what the most important number is, and no way to explain how any of the numbers relate to each other.
A second failure is the absence of cause-and-effect logic. Many organizations track outcomes (revenue, costs, customer complaints) without tracking the process behaviors that generate them. When performance deteriorates, there is no way to trace the cause.
A third failure is the disconnection between levels. Senior leaders monitor strategic metrics while operations managers track process indicators, and these two sets of data live in separate systems, reviewed in separate meetings, with no shared frame of reference. As a result, cross-functional decision-making becomes slow, reactive, and poorly grounded.
A well-constructed KPI tree resolves all three failures at once: it limits measurement to what matters, makes cause-and-effect traceable, and creates a shared language across the strategic, tactical, and operational levels of the organization.
From diagnostic to KPI Tree: The logical connection
In Part 1 of this series, the 60-minute operational diagnostic identified the primary constraint in the value stream: the point where flow breaks down, capacity is consumed, or variation creates downstream disruption.
That diagnostic output is the starting point for the KPI tree. The constraint defines the root KPI: the performance lever that, if moved, will have the greatest measurable impact on the system. Everything else in the tree must connect back to it.
Identify your biggest operational constraint in 60 minutes
The distinction matters. A KPI tree is not built by organizing every metric the organization currently tracks into a hierarchy. It is built by starting with the constraint, identifying the drivers that sustain it, and tracing those drivers back to the operational behaviors that teams can change.
The sequence is:
- Define the root KPI based on the diagnostic finding.
- Identify the two to four primary branch KPIs that drive the root KPI.
- For each branch KPI, identify the leaf KPIs that teams observe and influence daily.
- Validate the cause-and-effect logic at each step: If this leaf KPI improves, will the branch KPI improve? If this branch KPI improves, will the root KPI improve as well?
- Remove any metric that cannot be connected to the root KPI through a clear causal chain.
The output is a focused and traceable measurement structure, not a comprehensive inventory of everything the organization measures, but a precise map of what drives the constraint.
How to build a KPI Tree in a workshop
A KPI tree is best built in a facilitated workshop with cross-functional participation. The session typically runs two to three hours and involves operations managers, process owners, and frontline team leaders. The objective is not consensus on a spreadsheet, but alignment on the causal logic of performance.
Step 1. Anchor on the root KPI
Begin with the diagnostic output. State the primary constraint clearly: our constraint is X, and the metric that best represents it is Y. Write the root KPI at the top of the whiteboard. This is the non-negotiable anchor. Everything else builds toward or away from it.
Step 2. Identify the branch KPIs
Ask: What are the two to four factors that most directly drive this root KPI? Facilitate a brief, structured discussion to surface candidates. Test each one by asking whether the team can explain the direct mechanism connecting it to the root KPI. If the connection requires an intermediate step, it is a leaf KPI, not a branch KPI. If no connection can be established at all, it does not belong in the tree.
Keeping branch KPIs to a maximum of four ensures accountability remains clear and the tree remains manageable in daily operations.
Step 3. Identify the leaf KPIs
For each branch KPI, ask: What operational behaviors and process conditions drive this? Leaf KPIs must be measurable at the process level, visible to frontline teams, and updated at least daily. Examples include machine availability, setup time, first-pass yield, order entry accuracy, and on-time delivery by line.
Step 4. Test for trade-offs and conflicts between KPIs
One of the most important and most frequently skipped steps is checking for trade-offs and conflicts between KPIs. A leaf KPI that optimizes local efficiency may damage a branch KPI that measures flow. Maximizing batch sizes to improve equipment utilization, for instance, may increase machine productivity while growing lead times and inventory, directly harming the root KPI.
Map these conflicts explicitly. They do not disqualify a metric, but they must be acknowledged and managed. Ignoring them leads to local optimization at the expense of system performance.
Step 5. Assign ownership
Every KPI in the tree requires a named owner: one person accountable for monitoring it, understanding its behavior, and responding when it deviates. Ownership does not mean the person causes the number to move. It means they are responsible for ensuring that deviations are identified and acted upon.
Establishing the baseline in 48 hours
Once the KPI tree is defined, the next step is establishing a performance baseline — a clear, quantified picture of current performance for every metric in the tree.
The baseline serves three purposes. First, it tests whether the KPI tree reflects reality: if data for a metric is unavailable or unreliable, that is a finding. Second, it creates a reference point against which improvement can be measured; without it, any claim of progress is impossible to verify. Third, it surfaces gaps that would otherwise go unnoticed: the process of collecting baseline data almost always reveals performance problems that were known but never quantified, as well as others that were not known at all.
The 48-hour framing is deliberate. It forces prioritization and prevents the baseline from becoming a prolonged data collection exercise. In practice, this means:
- Using existing data wherever possible, even if imperfect. The baseline does not need to be statistically rigorous. It needs to be directionally accurate and agreed upon by the team.
- Assigning one person per KPI to confirm the current value, the data source, and the measurement frequency.
- Documenting gaps explicitly. If a leaf KPI has no data source, that absence is itself a finding. It means the organization is operating without visibility into a driver it cannot afford to ignore.
- Setting a single review point at the 48-hour mark where all baseline values are presented, challenged, and validated by the team.
At the end of those 48 hours, the organization has two things it did not have before: a structured causal map of performance, and a quantified starting point for every metric in that map. Together, they transform the vague ambition of improving operational performance into a specific, measurable, and owned program.
Establish the baseline for improving efficiency, quality, and productivity
KPI Tree template
Use the structure below to map your KPI tree from the diagnostic output. Start with the root KPI, define two to four branch KPIs, and assign leaf KPIs to each branch. Every KPI requires a named owner and a data source before the baseline sprint begins.
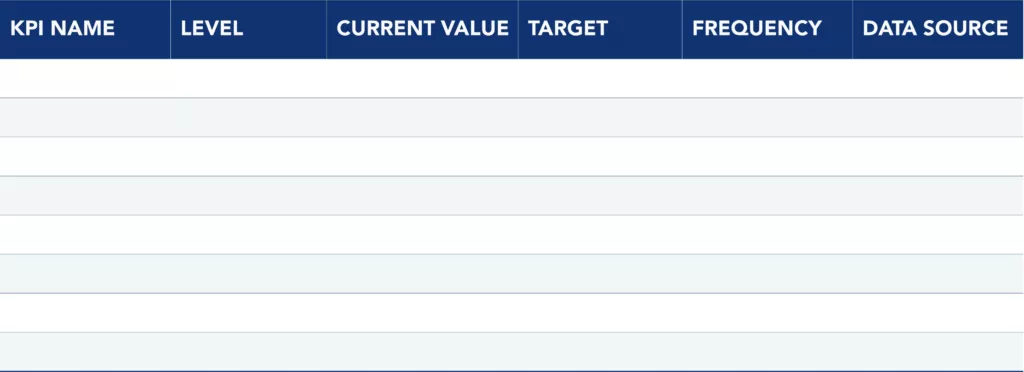
48-hour baseline tracker
For each KPI in the tree, assign one person to confirm the current value, the data source, and the measurement frequency within 48 hours. If a data source does not exist for a given metric, that absence should be recorded as a finding rather than used as a reason to leave the row blank.
KPI Trees in manufacturing and lean production
In manufacturing and lean production environments, KPI trees take on operational significance. The constraint identified in the diagnostic is typically a bottleneck station, a recurring quality issue, or a planning process that generates unplanned variation. The root KPI is most commonly Overall Equipment Effectiveness (OEE), throughput, or cost per unit produced.
In these environments, the branch and leaf KPIs map directly to the three sources of loss (availability, performance, and quality) and to the standard Lean performance domains: Safety, Quality, Delivery, Cost, and Motivation (SQDCM).
A KPI tree structured around SQDCM enables teams to manage performance across all five dimensions without losing sight of the causal relationships among them. Safety incidents, for example, are not simply a compliance metric; they are often a leading indicator of process instability that, left unaddressed, will manifest in downstream quality and delivery performance.
In smart production systems environments, KPI trees provide the structural foundation for digital performance management. Connected sensors, manufacturing execution systems, and real-time dashboards generate large volumes of operational data, but without a defined hierarchy of metrics and their causal relationships, that data produces noise rather than insight. The KPI tree is not a pre-digital tool that has been made obsolete by technology. It is the interpretive framework that makes digital data meaningful and actionable.
Common errors to avoid
Selecting too many KPIs
A tree with more than twelve to fifteen metrics across all three levels becomes unmanageable and dilutes focus. Beginning with a reduced set of metrics and expanding only when gaps in the causal logic become evident is preferable to building an exhaustive tree from the outset.
Choosing metrics that frontline teams cannot influence
Revenue is an important business goal, but a poor root KPI for an operational excellence program if frontline teams have no direct levers to move it. The root KPI must be close enough to operations that the causal chain is traceable and actionable.
Skipping the trade-off analysis
Conflicts between KPIs are the norm in complex manufacturing or service environments. Mapping them is not a sign of a poorly designed tree, but a sign of analytical rigor.
Treating the baseline as a one-time exercise
The baseline is the starting point. The KPI tree is a living management instrument. As improvement progresses, baselines reset, branch KPIs evolve, and new constraints emerge, the tree must be reviewed and updated.
Separating the KPI tree from daily management
A KPI tree that lives in a strategy document but is not connected to daily team reviews, visual management boards, or operational decision-making has no operational impact. The tree must be embedded in the rhythm of daily work — reviewed at the start of each shift, discussed in stakeholder alignment sessions, and acted upon when deviations occur.
From measurement to flow: What comes next
With the KPI tree built and the baseline established, the organization has a measurement architecture that connects operational behavior to strategic outcomes. The next step is to understand the flow of work that produces those outcomes and to identify, with precision, where that flow breaks down.
Next in the series
Part 3/6: Map Flow End-to-End — Value Stream Mapping and Bottleneck Capacity
The KPI tree defines what needs to improve. Part 3 introduces Value Stream Mapping (VSM) as the primary tool to visualize the end-to-end flow of value, quantify waste at each step, and measure constraint capacity using OEE data. The VSM reveals where and how to focus improvement efforts.
The full series is organized as follows:
Part 1: Find the Constraint — The 60-Minute Operational Diagnostic
Part 2: Build the KPI Tree — Baseline Performance in 48 Hours
Part 3: Map Flow End-to-End — Value Stream Mapping and Bottleneck Capacity (OEE at the Constraint)
Part 4: Stop Firefighting — Standard Work and Daily Management That Sticks
Part 5: Build-In Quality — A3 Problem Solving and Quality Routines
Part 6: Make It Last — Governance, Capability Building and 90-Day Rollout Plan
The “90-Day Operational Excellence Blueprint” is a six-part series providing a structured methodology for identifying, prioritizing, and resolving the operational constraints that limit performance. Each article builds on the previous one, from diagnostic to implementation.
See more on Manufacturing Operations
Find out more about improving this business area