
Article
Production efficiency: Formula, metrics and how to sustain it


Most manufacturing operations are aware of their production efficiency score. However, there has been less focus on developing the systems that enable it to function and maintain its position. For plant leaders focused on manufacturing production efficiency, the gap between measuring performance and improving it is where competitive advantage is either built or lost. This article provides a comprehensive overview of production efficiency, including its calculation, the most impactful manufacturing KPIs, and methods to establish operational discipline for sustainable gains in manufacturing productivity.
What is production efficiency?
Production efficiency measures how effectively a manufacturing operation converts inputs (labor, materials, equipment time, energy) into outputs relative to its maximum theoretical capacity. When actual output matches maximum possible output under ideal conditions, the operation is running at 100% production efficiency. In practice, losses from downtime, quality defects, and speed reductions push most facilities well below that ceiling.
The economics discipline uses the term more precisely. Productive efficiency describes the state in which a firm or economy produces on the boundary of its Production Possibility Frontier (PPF) the maximum output of one good achievable for any given output of another, given fixed resources. Any combination of outputs inside the PPF represents productive inefficiency: resources are being wasted or underutilized.
Allocative efficiency, by contrast, asks whether resources are directed at their highest-value use. A plant can be productively efficient, running at full capacity, while being allocatively inefficient if it produces the wrong product mix relative to market demand. Both matter, but in manufacturing operations, closing the productivity efficiency gap typically delivers the more immediate and measurable return.
The production efficiency formula
The standard calculation is straightforward:

If a line can theoretically produce 500 units per shift under ideal conditions and produces 380, its production efficiency is 76%. The 24% gap represents recoverable capacity, output that could be generated from existing assets and labor without capital investment.
In practice, the Overall Equipment Effectiveness (OEE) metric operationalizes this formula as a composite of three factors:

- Availability — the percentage of scheduled time the equipment is running (losses: breakdowns, changeover, unplanned stops)
- Performance — actual speed relative to ideal speed (losses: minor stops, reduced throughput, idling)
- Quality — good units as a percentage of total units started (losses: defects, rework, startup scrap)
World-class OEE is generally benchmarked at 85% or above. Most manufacturing facilities operate at 40–60%, which means most available capacity improvements lie within the existing asset base.
The six sources of loss identified by Total Productive Maintenance (TPM), equipment failure, setup and adjustment, idling and minor stoppages, reduced operating speed, defects and rework, and startup losses, map directly onto the three OEE components. Reducing unplanned downtime is typically the highest-leverage intervention because equipment failure is both the most visible and the most addressable loss category.
Why production efficiency gains are hard to sustain
Measurement is not improvement. Every organization that tracks OEE and manufacturing KPIs knows this, yet the cycle repeats: an efficiency drive produces gains, the gains erode over the following quarters, and the next initiative starts from a lower baseline than expected.
Three patterns account for most regression. First, improvements are event-driven rather than systemic. A kaizen event tightens a bottleneck, but without standard work documentation and enforcement, the process drifts back. Second, performance management stays at the aggregate level; weekly OEE reports are reviewed in conference rooms, rather than daily line-level data is reviewed at the gemba. By the time the weekly number flags a problem, three to five days of capacity loss have already occurred. Third, the causal chain between specific losses and their root causes is never closed. Downtime reduction initiatives address symptoms; they don’t surface why equipment fails repeatedly.
Sustaining production efficiency requires an operating system, not a measurement system. The distinction is consequential.
Have your plant’s operating system, not just its KPIs, evaluated
How to improve production efficiency
The following key steps provide the framework for building a sustainable, high-performing manufacturing environment:
Map the value stream before intervening
Before targeting specific losses, Value Stream Mapping (VSM) provides an end-to-end view of where muda (waste) accumulates across the production flow. Process optimization that skips this step risks improving a non-bottleneck, a change that consumes resources without raising throughput. VSM reveals cycle time, inventory accumulation points, and information flow gaps that aggregate KPIs obscure. It also identifies whether the constraint is equipment-based, labor-based, or material-flow-based, which determines the right intervention sequence.
Establish standard work as the baseline
You cannot improve what isn’t defined. Standard work, documented as the best current method for each operation, including cycle time, task sequence, and in-process inventory, is the reference point against which deviations are visible. Without it, every operator runs a slightly different process, and the aggregate OEE number masks the variance. With standard work in place, supervisors can immediately see whether a line is performing to method or drifting and respond before the shift ends rather than discovering the problem in next week’s data.
Deploy TPM
The single largest driver of production efficiency loss in most discrete manufacturing environments is unplanned downtime. TPM addresses this by shifting maintenance responsibility from a reactive, specialist function to a shared discipline between operators and maintenance teams. Autonomous maintenance best practices give operators the skills and authority to perform routine inspection, cleaning, and minor servicing, creating the condition for early detection of deterioration before it becomes failure. This reduces downtime events and extends equipment lifespan, simultaneously improving Availability and lowering unit cost.
Build daily management routines
Manufacturing operations that sustain high efficiency share a structural feature: they manage performance daily, not weekly. Daily KAIZEN™ routines, brief structured reviews at the line level each shift, create the response cadence that prevents small deviations from compounding into large losses. Supervisors review actual vs. target output, surface the top two or three losses from the previous period, and assign and track countermeasures. This is the mechanism that closes the loop between measurement and action. What is kaizen in this context? It is the discipline of treating every gap between actual and standard performance as a problem to be solved, rather than accepting chronic underperformance as “normal.”
Address workflow optimization systematically
Workflow optimization in manufacturing encompasses three levers: flow (eliminating batching and queue buildup between operations), resource utilization (matching labor and equipment deployment to actual demand rather than to theoretical plans), and capacity utilization (aligning production scheduling with the real constraint rather than nominal capacity). Together, these reduce the non-value-adding time that inflates cycle time and depresses first pass yield. Operational excellence in manufacturing emerges from the compounding of these incremental improvements over time, not from any single intervention.
For operations seeking to quantify the financial impact, the link is direct: higher throughput, lower scrap rate, and reduced downtime collectively reduce unit cost. Cost reduction strategies built on efficiency gains are structurally more durable than cost reduction achieved through price negotiation or headcount reduction, because they improve the underlying production system rather than simply extracting margin from it.
Achieve sustainable flow across every production line
Key manufacturing KPIs for tracking production efficiency
Effective tracking requires a small set of complementary metrics rather than a single headline number. The following manufacturing KPIs provide a complete view across quality, speed, availability, and cost:
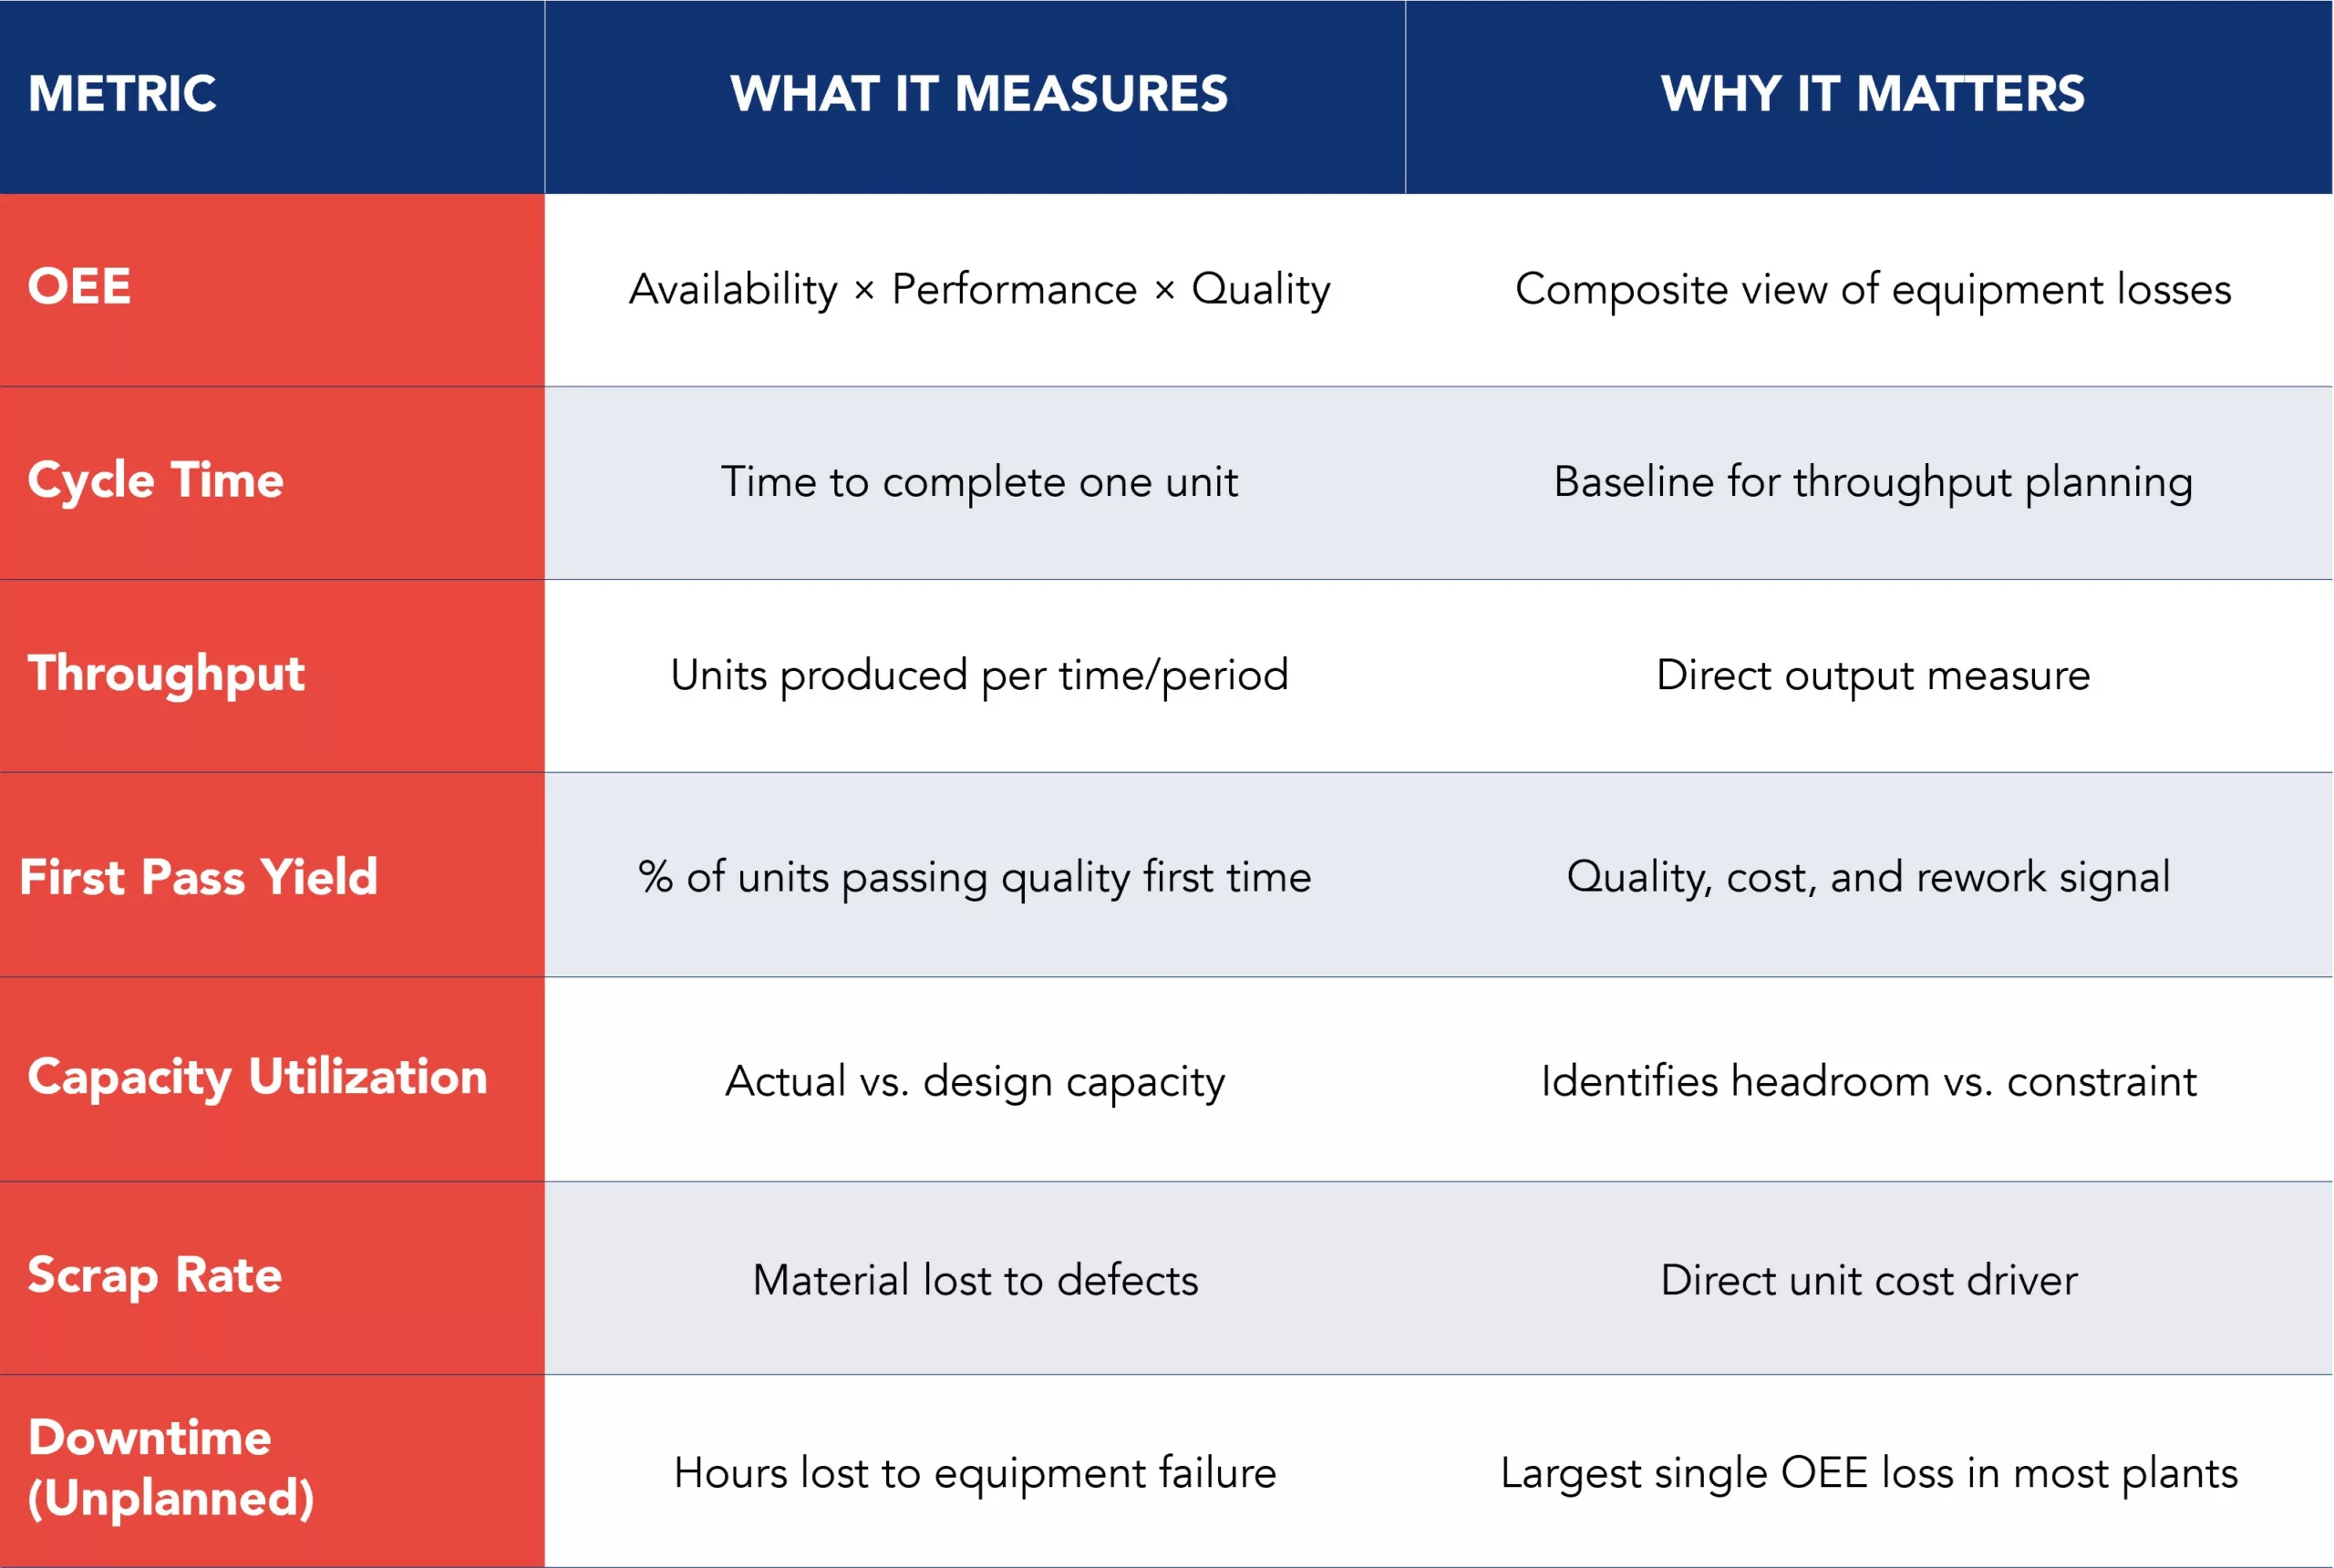
Table 1 – Core manufacturing KPIs for tracking production efficiency
In polymer production and food processing operations, first-pass yield and scrap rate deserve particular attention, given the raw-material cost intensity. In high-mix, low-volume environments, changeover time and its effect on availability often dominate the OEE profile.
Building efficiency that compounds
Production efficiency is ultimately a question of operating discipline, not calculation sophistication. The formula is straightforward. The metrics are well-established. What separates high-performing manufacturing operations from the rest is the management infrastructure that responds to deviations daily, systematically closes root causes, and maintains the standard work against which all improvement is measured.
Organizations that treat continuous improvement in manufacturing as a periodic initiative will see periodic results. Those who embed it as a daily operating system through gemba-based leadership, structured daily routines, and sustained capability-building see efficiency compound over years, not quarters.
Through our manufacturing operations consulting, we assist industrial organizations in realizing the concept of compounding efficiency in their daily operations. Kaizen Institute’s approach to business improvement involves a hands-on collaboration with your teams on the shop floor. We don’t just implement isolated tools; we integrate practical leadership routines and standardized processes that are crucial for maintaining stable operations and safeguarding profit margins. This systemic approach transforms daily problem-solving into a core organizational capability, ensuring your production system grows more resilient and efficient with every passing quarter.
Do you have more questions about production efficiency?
What is the difference between productive efficiency and allocative efficiency?
Productive efficiency means producing the maximum possible output from given inputs, operating on the production possibility frontier with no waste. Allocative efficiency means directing resources toward products or outputs that generate the highest value relative to consumer preferences. A factory can achieve productive efficiency (running at full capacity with no waste) while being allocatively inefficient if it produces the wrong product mix. In most manufacturing improvement programs, productive efficiency is addressed first because closing the OEE and capacity gap delivers immediate, measurable financial return.
What is a world-class OEE score?
World-class OEE is generally benchmarked at 85% or above, meaning approximately 85% Availability, 95% Performance, and 99%+ Quality. Most facilities begin their improvement journeys at 40–60% OEE, which indicates substantial recoverable capacity. Reaching 85% is achievable for most discrete manufacturing operations within two to three years of sustained improvement effort, provided the underlying management system supports it. Chasing 85% through measurement alone, without addressing root causes and building daily management routines, rarely delivers lasting results.
What is the production possibility frontier, and why does it matter for manufacturers?
The production possibility frontier is the economic concept that describes the maximum output combinations achievable with fixed resources. A firm operating within its frontier is productively inefficient; it produces less than it could with the available inputs. For manufacturers, the PPF is a useful mental model for understanding that every unit of capacity lost to downtime, defects, or underutilization is a point inside the frontier. The practical implication is that, before investing in new capacity, most operations can generate significant additional output from their existing asset base by closing the gap between actual and theoretically possible performance.
See more on Manufacturing Operations
Find out more about improving this business area