
Benchmarks & Case Studies
Segmentation based on CLV using Data Mining


Customer segmentation is increasingly needed where customer interests are vital for companies to survive. This project, applied in a food industry company, used data mining techniques to classify the customers according to their lifetime value (CLV). Each segment of the customers is described by a set of rules based on the customers’ purchasing patterns. The customer segments obtained will be used to boost marketing strategies, as these segments enable to differentiate the customers.
The company
The company in which the project was run is considered a sustainable and competitive company, investing on quality and innovation to build unique confectionary. Over the years, the company has been concerned about customer needs. For this reason, investing in the customers is a long-term strategy, essential to increase market share and stand out at national and international levels.
It should be noted that the customers of the company do not correspond to the end-customer, but to wholesalers and retailers, as this is a B2B company.
The challenge
The company under study categorises the market using geographic factors, due to the differences in the markets belonging to different countries. Segmenting customers by geographic area is a traditional segmentation approach, not being used to the same extent as before, as many services have become electronic, reducing the inherent distance difficulties. Moreover, the location may not represent similar purchasing behaviour.
The target of the project was to build customer segments based on customer lifetime value (CLV) to develop differentiated marketing approaches.
The data collected includes 28,259 transactions of 296 customers, over the period of one year.
The approach
The first step of the project was to organise the data into a dataset of 296 rows, each one representing one customer, and prepare it to the clustering phase. This dataset included 4 variables, i.e. the RFM variables – the time interval between the moment of analysis and the time of the most recent purchase (Recency), the number of purchases that the customer made within a considered period (Frequency) and the average value of the transactions (Monetary Value) – and the geographic location of the customer.
In the clustering stage, the RFM segmentation model was applied after defining the number of clusters based on the average silhouette method. The silhouette value (sil) is a measure of how an object is similar to its cluster (cohesion) compared to other clusters (separation), indicating a high value that the object is quite compatible with its cluster, unlike neighbouring clusters. The number of clusters, representing the number of customer groups that have similar RFM behaviour, was set to 5 and cover 83.6% of the total variance present in the dataset.
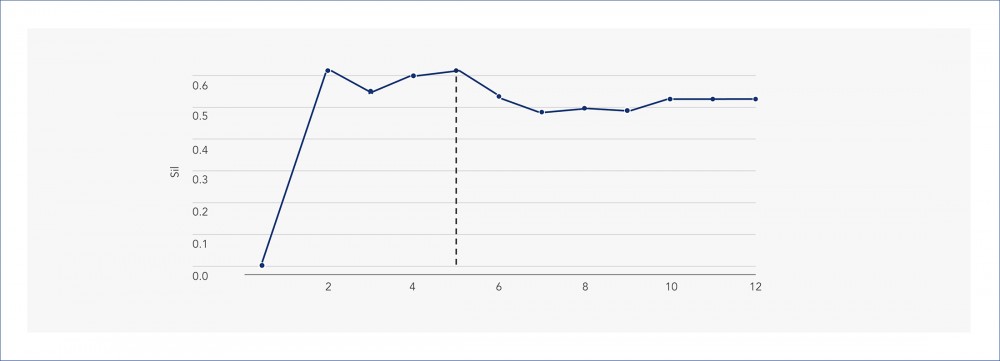
Average Silhouette Method
For a better understanding of each cluster, a decision tree presents the rules that enable the distinguishing of segments.
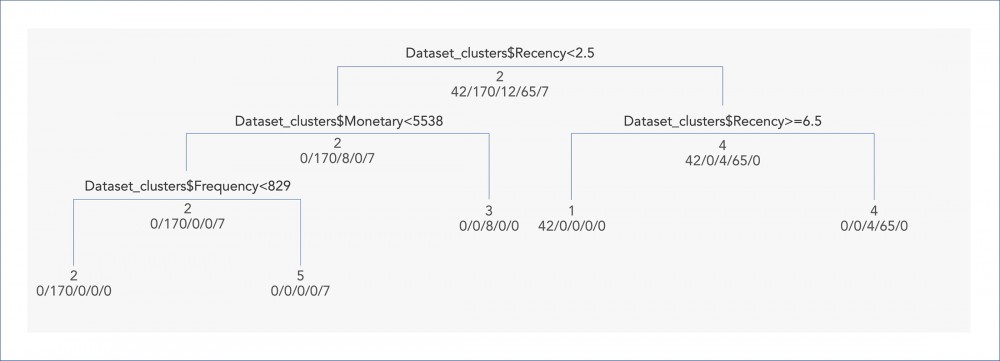
Decision Tree
The value of each segment for the company was assessed by the application of Weighted RFM (WRFM). For this purpose, it was necessary to define the weights of each of the RFM variables. This was performed using the Analytic Hierarchy Process (AHP). To define the relative importance of the criteria, the main decision-makers of the company were involved to compare each possible pair of criteria. After the comparison exercise, the consistency of the judgements made were and the CLV were evaluated.
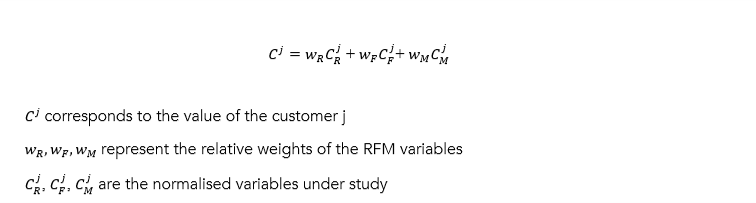
Note that the complementary to one of the normalised recency values was taken because Cj aims at measuring the value of the customer, which is higher when the recency is lower.
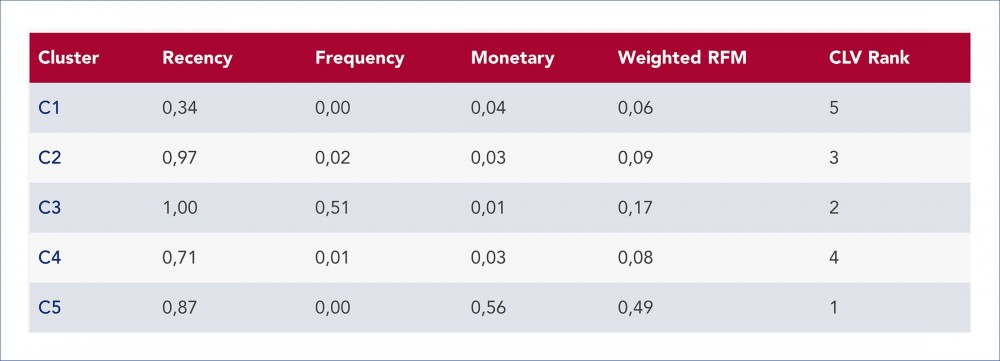
CLV Rank
Segment number 5 has the highest CLV value. In this case, most of its customers have recently purchased, with the highest buy-per-transaction average. These customers show the characteristics of a very valuable segment whose segmentation strategies should consider these specifications.
Achievements and next steps
By analysing the characteristics of the segments achieved, inferred from the decision trees, the company was very confident that the marketing strategy derived from the segmentation would bring growth results.
With the information resulting from this study, the company can define a specific strategy depending on the cluster characteristics. For the segment referring to the lowest value, marketing campaigns and discounts could be launched to stimulate buying, make current products known (for example, by providing samples), promote experimentation, dispose of products or blur seasonality of consumption. For clusters that currently have a higher value, premium treatment and a closer relationship with the customers, is recommended to maintain customer value. Given the company’s focus on innovation and the consequent launch of new products, it could be interesting to involve the most valuable customers in the ideation and/or to guarantee exclusive sales to reinforce their special nature.
#processmanufacturing #marketing&sales
See more on Process Manufacturing
Find out more about transformation in this sector
See more on Marketing & Sales
Find out more about improving this business area