Benchmarks & Case Studies
SKU Rationalization Program


To meet the market’s needs, the company’s strategy has always been to use a wide range of product references, each with its own specific characteristics. The entropy generated in production by this commercial dynamic was significant and it was necessary to develop a program to reduce the variety of product references. The benefit of this range optimization, in addition to the operational improvements, was a margin gain of over €4m.
The company
This success story unfolded at a company specialized in the production of wall and floor tiles, whose mission is to contribute to the creation of unique and inspiring environments through the production of technically advanced ceramic products with a Portuguese soul.
The challenge
Currently, for a company to stay competitive, it must be increasingly able to respond to market needs in a more effective and efficient way. To do this, the company in question has always had a strategy of using a wide range of product references, each with specific characteristics (shape, design, etc.).
A preliminary analysis showed that there were many collections in the different product families where the sales value was residual.
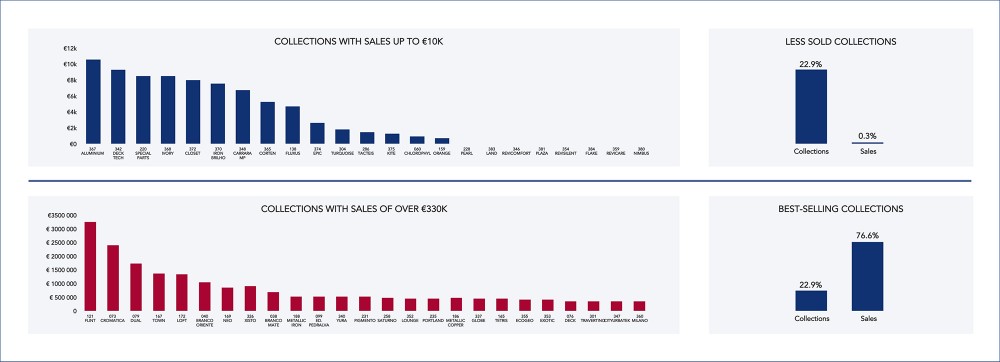
Distribution of collections and the respective contribution to sales
The entropy in production generated by this commercial dynamic was significant. It forced faster reference changes in order to allow the entry of more references per line while keeping production efficient and meeting the deadlines agreed with customers.
The cause of this problem was identified as a lack of product knowledge by the commercial staff (in terms of application and margin calculation), lack of technical product information (use of paper leaflets to inform of product dimensions) and the lack of online access to the stock.
This project reflects the overall effort that was made to meet the goals outlined: optimization of the product portfolio and increase of the gross margin.
The approach
The project was structured along 3 lines of action:
- Review of the Costing Model
- Product range analysis and rationalization
- Improvement of the commercial dynamics and merchandising
Costing model
The existing costing system’s weaknesses were identified as: a) product costing did not consider the entire value chain, but only the production hours of a production point – the oven and b) the distribution of structure costs was based on production volume. For example, for an industrial cost of €2m and a total of 20 hours of oven time, the industrial cost per hour of production was calculated at €100. Thus, a product that required 3 hours in the oven would have an industrial cost of €300 regardless of the production times in the press, tooling and sorting.
In order to translate this situation into the costing model, the production and setup hours of all production points were considered in the allocation of industrial costs, the elements that reflect the real effort of the support departments were identified and a costing model was defined for the different production units. With the new costing model, the industrial cost of the same product would therefore be €200 instead of the initial €100.
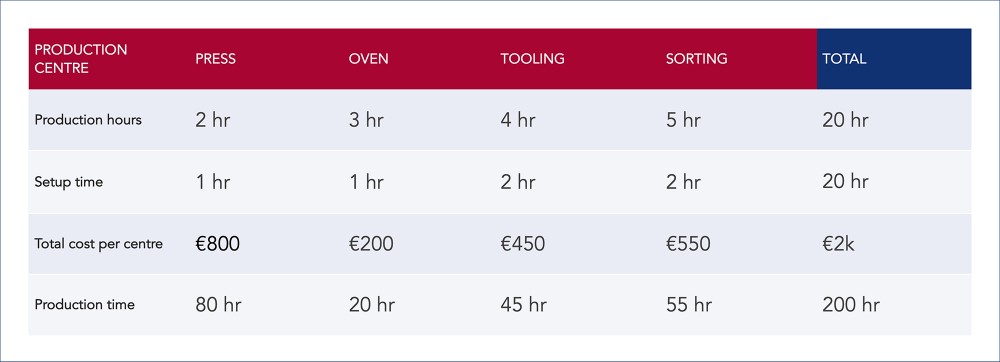
Example of data for product costing.
Products range
After reviewing the costing model, an analysis of the 2,985 product references was carried out, which were divided into 3 product families: single-fired tiles, glazed porcelain tiles and technical porcelain tiles and respective differentiation factors.
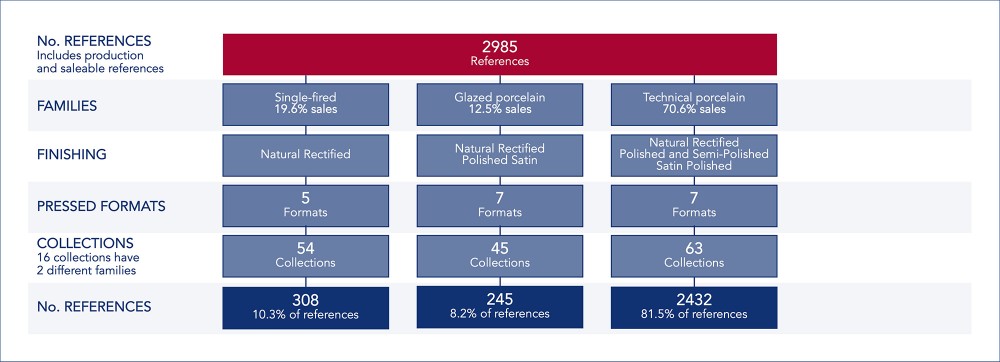
Stratification tree of finished products references
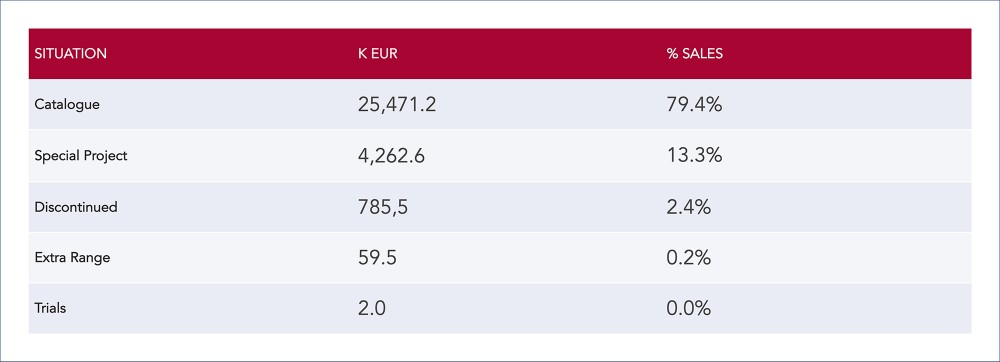
In addition, the references situation was analyzed, and it was determined that 92.7% of sales are from catalogue products and special projects.
Reference situation analysis
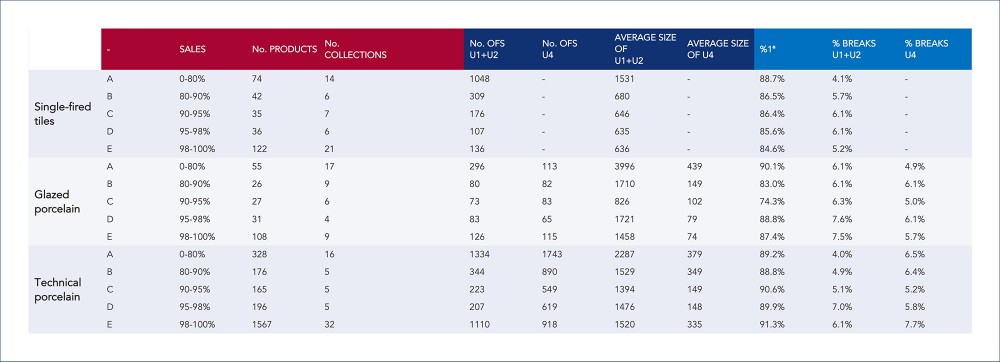
Each of these references was classified in terms of its total sales on a scale from A to E and some performance indicators were drawn up in order to understand the behavior of each product in the factory. Items classified as E (98%-100%), have high weight despite the low sales and poor-quality indexes.
Sales, variety and performance analysis of each product category per family
Next, a profitability analysis was done by product family and by reference. The life cycle of the collection was also determined to assess whether the growth was sustainable (number of collections in the upward part of the life cycle higher than the number in the downward cycle).
Margin per family
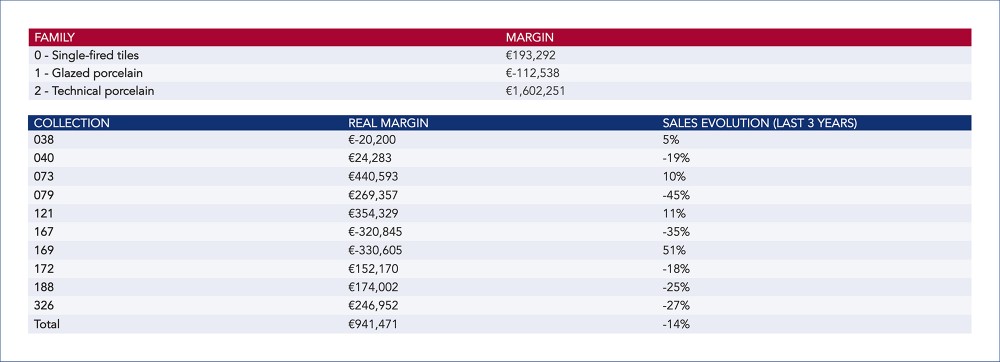
Sales values and margin of some collections
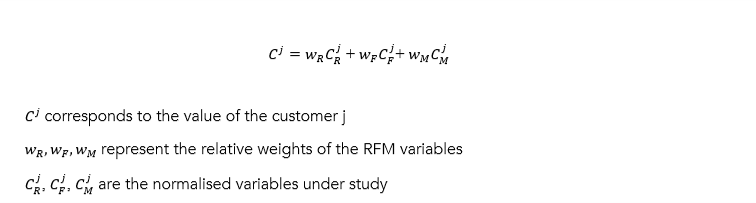
Based on the previous analyses, a rating was assigned to each product that results from the combination of sales with margin and sales evolution. For example, products with residual sales, a very negative margin and a 25% decrease in sales are classified as XXX and are the main candidates for discontinuation.
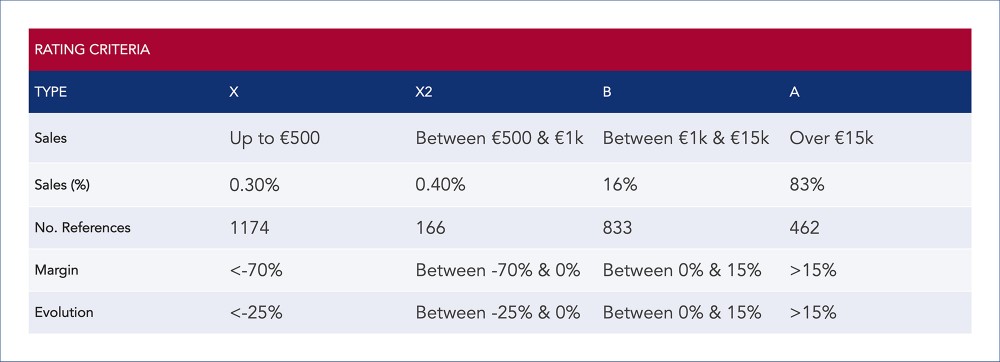
Rating Criteria
On the other hand, rationalization work was also carried out on the number of formats, allowing a significant reduction in variety.
To overcome the paradigm that reducing the number of references would have an impact on sales, pilots were carried out with strategic customers and some specific formats and references, and sales were monitored over the course of half a year. After proof of concept, the roll-out to the remaining selected references and customers was made.
Commercial dynamics and merchandising
As a way of supporting the commercial dynamics and directing sales towards more profitable references, the company created a software that allows product consultation with several filters (Color, Collection, Format, Price, Environment), visualization of product images and online access to the existing stock in the company. The developed system also allows access to suggestions of similar products and respective stock to facilitate cross and up selling.
However, it is not enough to rationalize the offer and guide the salespeople, it is also crucial to work on the product layout at the retailers, in the showroom and on the website where the customer gets to know the offer. With this awareness, a workshop was developed to define and implement the merchandising strategy. Within this scope, customer clusters were defined, criteria for product/application valuation per cluster, routines for process confirmation in the field and a feedback mechanism.
In order to sustain the implemented improvements and instill a spirit of improvement amongst the sales team, new Daily KAIZEN™ dynamics were created. The highlights were the load levelling through the work plan, the follow-up of new KPIs (e.g., margin and defects) and a more frequent follow-up of the communication and promotion plan. Also important for the knowledge development was the establishment of a training plan.
Results
The variety reduction was done progressively over two years, so that by the end, there was a reduction of 403 references of finished product (equivalent to 33%) and 20 references of powders (equivalent to 23%). The benefit achieved with this program was €1.8m in the first year and €4.2m in the second year.
As non-quantifiable benefits, the focus goes to the improvement in the delivery time, the freeing up of storage area, the increase in motivation of the salespeople and retailers and a better response when launching new collections.
#processmanufacturing #product management
See more on Process Manufacturing
Find out more about transformation in this sector
See more on Product Management
Find out more about improving this business area