A success story of adapting the Lean philosophy to the process industry, through a shift from resource efficiency to a flow efficiency.
The company
The case portrays the KAIZEN™ journey of a company operating in the wood-based products sector and presenting a high complexity in supply with operations dispersed across several countries and a significant export volume.
The project originated from the inability of the manufacturing system to keep up with the rhythm of customer orders, which is reflected in the non-fulfillment of the production plan and consecutive order delays. The main objective was to increase global efficiency without significant investment in additional capacity.
The company’s production process is divided into four stages:
- Panel formation (continuous line)
- Surface finishing
- Paper impregnation
- Panel coating
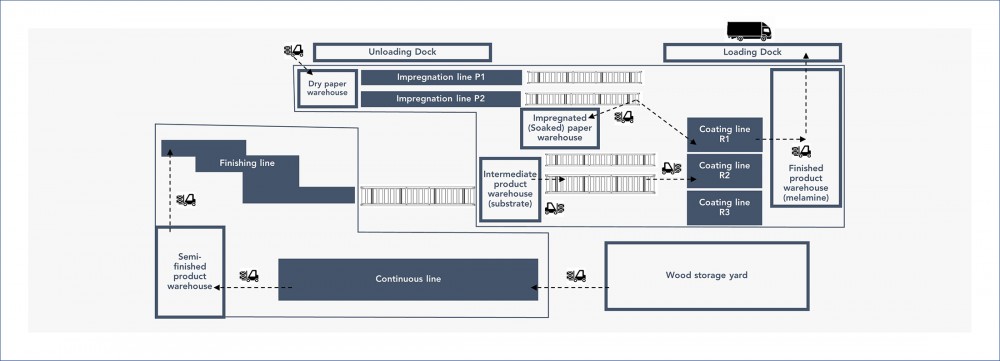
Factory layout
The panel coating lines were the bottleneck of the factory and, at the same time, the area with the highest added value, thus being the most critical part of the process and requiring the most immediate intervention. At this stage of the process, there are three lines: R1 is the smallest and most flexible, R2 is similar in terms of capacity but is the least flexible of the three, and R3 is the most modern and fastest line.
The challenge
Based on pressure from its competitors and the growing importance of differentiation, the company needed to improve its performance to be able to meet market demand.
An increase in plant productivity, coupled with a reduction in product complexity, would make it possible to close the existing delivery reliability gap. Up to a certain limit, any gain in productivity translates into an increase in sales, recovery from delays and reduction in delivery times. For this, it was estimated that global efficiency needed to increase by 20%, focusing mainly on the coating lines where the main capacity limitation was.
The approach
In a preliminary analysis of the coating lines, several points with potential for improvement were diagnosed, of which we highlight push production planning, excessive stock level of references without demand, high setup times between series, undifferentiated allocation of products to production lines (the same article is manufactured on different lines, without any rule), frequent overloading of conveyor belts carrying raw material for coating (two belts to supply three lines) the mismatch between catalog batch size, coating batch size and raw material batch size (which leads to a lot of reverse logistics), the under-utilization of the capacity of the production lines in relation to the theoretical specifications and the inexistence of equipment parameterization standards during operation.
To achieve the defined objectives, actions were defined and implemented on two fronts:
-
- Flow creation: Design of a pull planning system to reduce lead time and increase the rate of compliance with customer delivery deadlines.
- Efficiency increase: Implementation of Lean tools to improve the availability, yield and quality of the coating lines to increase the overall efficiency of the facility in order to make the operation more flexible and profitable.
Flow creation
A global review of the production chain flows and the respective planning model was carried out based on two fundamental paradigms of Lean philosophy: the dedication of references to production lines and production/replenishment based on orders or actual consumption.
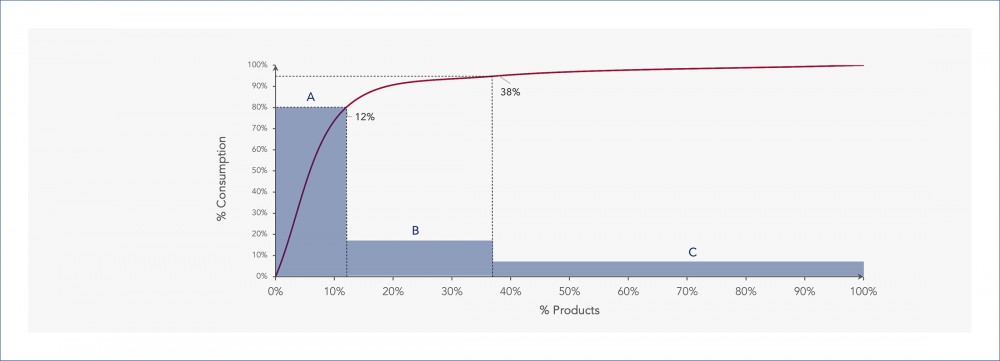
ABC diagram for finished products references
The classification of the finished product by consumption level shows that 12% of the products made up 80% of total consumption, 26% were intermediate turnover products, and 62% concerned sporadic orders and small quantities.
The criteria used to allocate products to lines was as follows: high turnover products should be produced for stock (KANBAN system) on lines with a higher cadence, while those with a lower turnover are preferably allocated to more flexible equipment. Thus, the fastest line (R3) was dedicated to the items of greatest consumption, while the small series were made to order on the most flexible line (R1). The third line (R2) was allocated to intermediate consumption items, belonging to class B, and some class A items, for capacity management reasons.
To take full advantage of the line’s allocation, an important investment decision was made to integrate the coating process upstream, thus solving a critical source of waste. The installation of a third conveyor has allowed the existing functional barrier to be broken down at the coating level, enabling each conveyor to be dedicated to only one line, ensuring that there is no material bottleneck or machine stoppages due to supply problems.
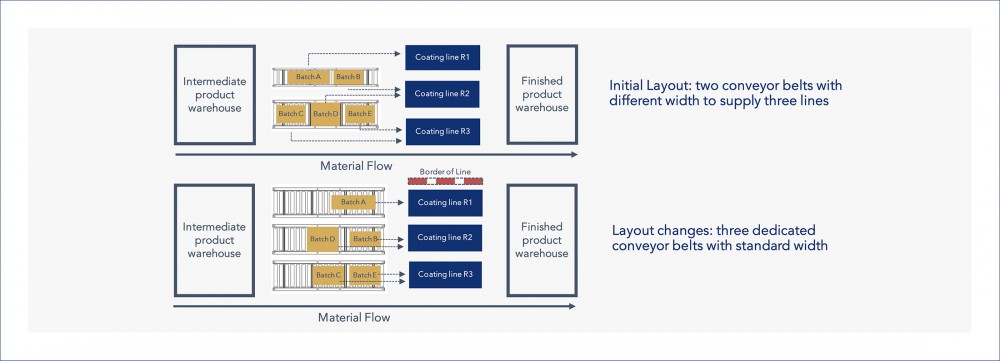
Material flow in the feeding of coating lines
Another important initiative was to standardize the batch size throughout the factory. As customer orders arrive in terms of batch numbers, it is intended that for each product the batch sizes of raw material and finished product are equivalent to each other and equal to the order batch size. This action reduces wasteful material transportation, stock accumulation and reverse logistics but requires greater equipment flexibility in switching between production runs.
Efficiency increase
In a process industry, the main performance indicator is the Overall Equipment Effectiveness (OEE). Increasing the OEE means acting on at least one of its three components: operational availability, performance or quality. Operational availability is the effective production time compared to the expected opening time of the facilities; performance measures the cycle time or speed of the machines compared to the theoretical values stated in the equipment’s technical specifications; and quality is a measurement of the product acceptance rate. In this sense, a series of improvement initiatives have been defined.
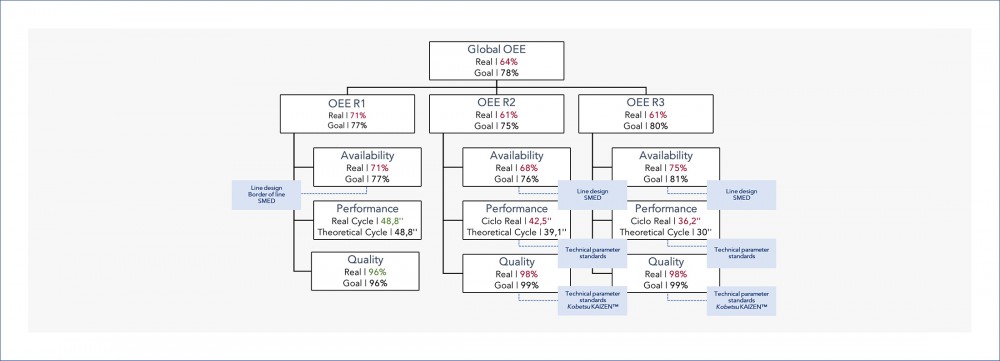
OEE value tree and improvement vectors
In the vision designed for the R1 line, where the focus was on increasing flexibility in the manufacturing of small series without affecting opening times, the operational actions with the greatest impact on increasing availability were the implementation of a sequenced border of line for rapid preparation of small production batches and SMED to reduce changeover times between production series.
On R2 and R3 lines, which have a higher cadence and manufacture larger batches, the initiatives designed were aimed at increasing the OEE in all three areas. The assignment of a conveyor to each line, together with SMED initiatives, allowed for a reduction in unproductive times, while the optimization and standardization of technical speed parameters of equipment allowed for an increase in machine cadence and a regularisation of the product approval rate. As an initiative dedicated to the reduction of non-quality rates, the improvement focus, through the tool Kobetsu KAIZEN™, stood out.
Results
The retailer achieved significant gains in all target indicators: overall productivity of the operations team increased by 25%, and stock levels fell by 21% and 12%, respectively. Customer satisfaction surveys show an increase of 7%, mainly due to a reduction in shelf turnover and a general improvement in convenience and in-store experience.
The combined effect of the operational indicators resulted in an impactful increase in sales, with a confirmed growth of around 15%. It is estimated that in the months following the project, the company’s market share increased by around 2.2%.
There is now greater stability and predictability in logistical processes, and an increase in the speed of reaction of the teams in the shops.
#process manufacturing #operations
See more on Process Manufacturing
Find out more about transformation in this sector
See more on Operations
Find out more about improving this business area
