
Benchmarks & Case Studies
Continuous Improvement at a City Council


This project was developed in the procurement department of the county with the target of decreasing processes’ Lead Times. The 3 improvement areas were KPIs’ monitoring, daily management routines and improvement, standardization and automation of tasks. In the end, processes’ Lead Times were reduced by 43% on average.
The company
The City Hall is the executive body of the city and its mission is to define and implement policies that promote the County’s development in different areas, such as: social action, environment, culture and science, education, spatial planning and urbanism, patrimony, civil protection, etc.
This project was developed in the procurement department, which is part of the financial area of the county. Managing a budget of around 24 million pounds per year, it is currently constituted of 32 people organized into 2 divisions: the public contracts division and the centralized contracts division.
The department’s main responsibilities are guaranteeing legal counseling for the municipality procurement activity and purchasing and contractual management of the centralized categories.
The challenge
In the planning phase, the key processes were mapped, and many opportunities were identified with the target of decreasing processes’ Lead Times.
The teams were performing activities without added value in the eyes of the internal customers, there were no KPIs and daily activity monitoring and processes’ outputs and outcomes varied a lot due to lack of standardization.
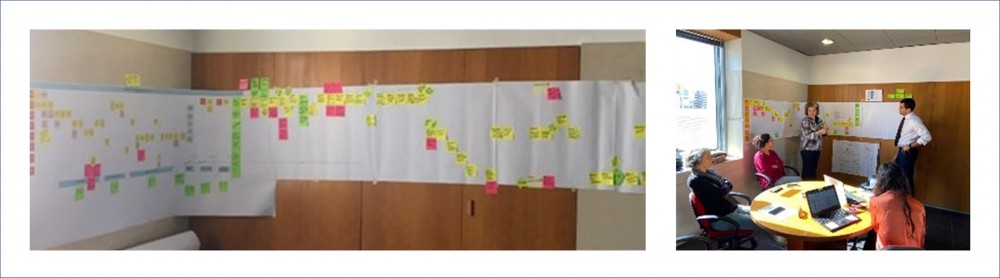
Processes’ maps
The approach
The pillars of improvement were the following:
- Process Lead Time monitoring;
- Daily management;
- Improvement, standardization and automation of tasks and forms.
Process Lead Time Monitoring
The first step of the project was to identify key performance indicators and define the measurement system: calculation formulas, input data and storage database.
Then, the database was created in MS Excel and the teams started to fill up with process data. During the first weeks, there was a control procedure to guarantee correct inputs.
At last, a dashboard with Lead Time analysis was created in MS Power BI. This dashboard allowed us to check in real time the number of open processes, average Lead Time per stage of the process, process execution rate (in terms of budget and time) and backlog analysis (per person, internal customer, entry date and type of procedure). The total savings accounting for all the improvements made by the teams were also shown in the report to motivate people to go further.
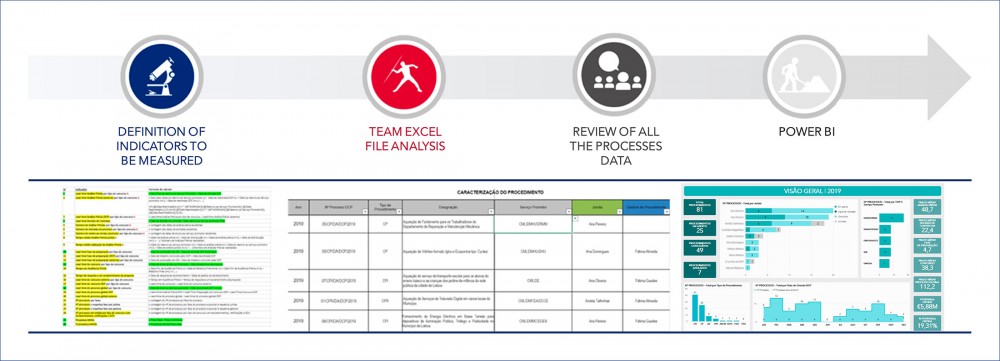
Process to define KPIs until report setup
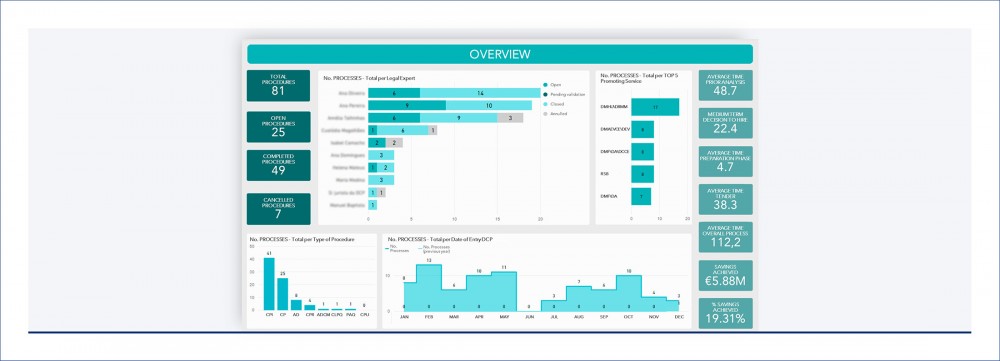
KPIs dashboard
Daily Management
All teams were enrolled in new Daily Management routines such as team meetings to analyze KPIs, work plan and track improvements and KPIs recording.
The team boards that support the weekly meetings have 5 key elements: agenda and attendance map, communication area, pending tasks, KPIs dashboards and improvement cycle (PDCA).
Since this project started during the covid-19 pandemic, the team meetings are conducted virtually and the board was set up in a digital tool.
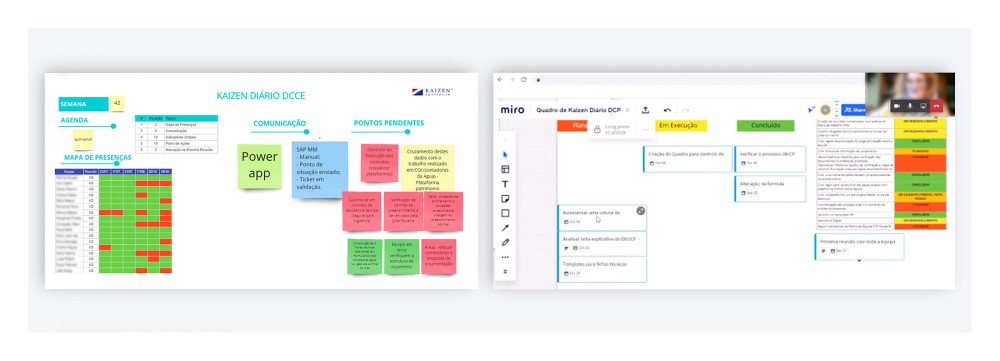
Daily team management board and meetings
Improvement, standardization and automation of tasks and forms
The last phase of the project consisted in optimizing the repetitive tasks with no added value for category managers.
One of the tasks simplified was the process of entering data from the Communication Category invoices, which was reduced from 4 hours to 5 minutes.
A procedures manual was then created with the aim of centralizing all the information necessary to the department. It includes the sequence of tasks for each process category, work instructions, templates for opening procedures and the SAP manual. The document is interactive and with free access.
Achievements
A Lead Time reduction was observed in all processes with the most significant improvement in direct adjustments (on average 55%). In national and international public tenders, Lead Times were reduced by 12% and 39%, respectively.
#publicsector #dailymanagement #administration
See more on Public Service
Find out more about transformation in this sector
See more on Administration & Service
Find out more about improving this business area