
Article
OEE in the automotive industry: How to calculate and improve equipment efficiency


In the automotive industry, even minimal fluctuations in availability, speed, or quality can have a substantial impact on a production line’s capacity. Breakdowns, however brief, sequences of microstoppages, speed reductions, or increases in the number of rejected parts may seem like isolated occurrences. Yet when they recur across shifts, they represent a considerable loss of productivity.
OEE (Overall Equipment Effectiveness) is one of the main indicators used to make these losses visible. Combining the variables “Availability,” “Performance,” and “Quality” makes it possible to assess what proportion of production time is actually converted into conforming product at the planned speed and without interruptions.
More than a percentage value, OEE is a diagnostic tool. When used consistently, it makes it possible to identify where losses are concentrated, set improvement priorities, and track the impact of the actions implemented.
In a sector that frequently involves interdependent equipment, short cycles, high volumes, and stringent quality requirements, this analysis is particularly relevant, especially in the context of the automotive industry’s transformation.
What is OEE, and why is it an important indicator in the automotive industry?
Overall Equipment Effectiveness measures the overall efficiency of a machine, piece of equipment, line, or production process, considering three fundamental dimensions: how much time it was available to produce, at what speed it produced, and how much of what it produced met quality requirements.
In other words, OEE helps answer an essential question: How much of the available production time was actually converted into conforming output at the expected pace?
It is precisely this perspective that makes the OEE indicator so relevant to industrial productivity. A piece of equipment may appear to be running for much of the shift and still show significant losses due to minor stoppages, a lower-than-planned speed, or defects.
Simply looking at machine run time does not make it possible to identify these differences.
Do you know where the losses on your production lines are hiding?
What does OEE measure?
The OEE calculation can be understood as the progressive reduction of the time initially available for production. From the total time, some periods may be excluded from opening time according to the rules defined by the organization, such as breaks or planned stoppages. However, from a continuous improvement perspective, the broader the period considered as opening time, the greater the visibility of losses and, consequently, of improvement opportunities, including those associated with planned stoppages.
During opening time, different types of losses then arise.
Equipment availability losses reduce the time during which the equipment can produce. Performance losses reduce the possible output in that period. Finally, quality losses correspond to the time spent producing nonconforming units.
The end result is effective time, i.e., the portion of time dedicated to producing added value.
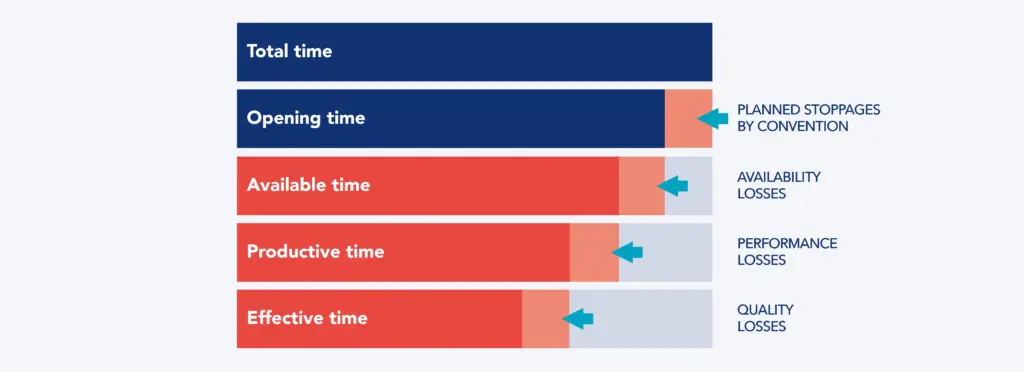
Figure 1 – Time breakdown in the OEE calculation: from total time to effective time
This breakdown is important because two pieces of equipment can show exactly the same OEE for completely different reasons. In one case, the main cause may be unavailability resulting from breakdowns. In another, the problem may lie mainly in speed losses or defects.
What are the three components of OEE?
OEE results from the combination of three components, each associated with one type of loss:
- Availability: Measures how much of the opening time was actually available for production.
- Performance: Measures whether the equipment was producing at the expected pace or cycle time during the period in which it was available.
- Quality: Measures the proportion of output that corresponds to conforming parts.
The overall result depends on all three factors.
OEE calculation formula: Availability × Performance × Quality
The OEE calculation formula is:
OEE = Availability × Performance × Quality
All three values must be expressed as decimal factors before multiplying. Although the formula is simple, the quality of the indicator depends on a rigorous definition of times, losses, and data collection criteria.
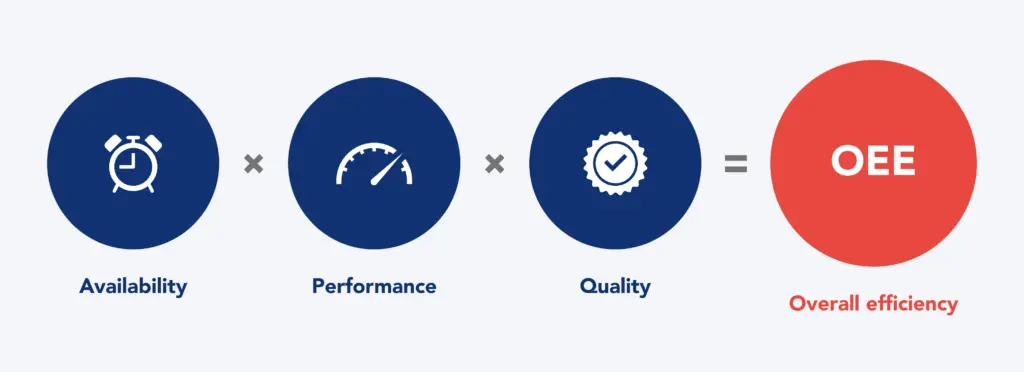
Figure 2 – OEE calculation formula
How to calculate Availability
Availability compares Available time with Opening time:
Availability = Available time ÷ Opening time
Opening time represents the planned production time for the equipment, according to the rules defined by the organization.
Opening time is reduced by availability losses, such as:
- Breakdowns.
- Repairs.
- Setups and product or part number changes.
- Adjustments.
- Certain maintenance operations and technical interventions.
- Startups and shutdowns that prevent production.
The result is the time during which the equipment was actually available to produce.
How to calculate Performance
Being available does not necessarily mean producing at the expected pace.
Performance assesses this second dimension.
One way to calculate it is:
Performance = Productive time ÷ Available time
Productive time can be determined based on the quantity produced and the ideal cycle time:
Productive time = Total number of parts × Cycle time
Therefore:
Performance = (Total number of parts × Cycle time) ÷ Available time
Performance losses include situations such as:
- Microstoppages.
- Minor interruptions.
- Reduced speed.
- Operating below the defined rate.
- Cycles longer than the reference cycle time.
- Short waiting times that are not recorded as availability stoppages.
This distinction is particularly important in high-volume automotive processes. Small losses repeated hundreds of times in a shift can represent a significant reduction in capacity, even if there is no major breakdown.
How to calculate Quality
Quality measures the proportion of output that results in conforming parts.
It can be expressed as the ratio of effective time to productive time:
Quality = Effective time ÷ Productive time
Considering the number of conforming parts:
Quality = (Number of conforming parts × Cycle time) ÷ Productive time
When the same cycle time is used for all units, this expression corresponds, in practice, to the ratio of conforming parts to parts produced.
Quality losses include, among others:
- Scrap.
- Rejects.
- Defects.
- Rework.
- Parts produced under unstable startup conditions or after part number changes.
A machine can therefore show high levels of availability and performance and still have a low OEE if a significant portion of output fails to meet quality requirements.
How to calculate the final OEE
Once the three factors have been calculated, multiply them:
OEE = Availability × Performance × Quality
This multiplication highlights the cumulative effect of losses. For example, three individually high indicators do not necessarily produce an equally high OEE. Availability of 90%, Performance of 90%, and Quality of 90% result in an OEE of approximately 73%.
The goal, therefore, should not be to analyze each indicator in isolation, but to understand how the different losses accumulate throughout the process.
Step-by-step OEE calculation example
Consider a piece of equipment operating on an eight-hour shift.
The total time is 480 minutes. If 30 minutes for meals or breaks are excluded according to the defined convention, the opening time is 450 minutes.
Different losses are recorded during this period.
Calculating Availability
Over the shift, the following occurred, for example:
- One 15-minute breakdown.
- One 60-minute setup.
- A second 20-minute breakdown.
- A 10-minute period associated with the end of the shift.
In total, these occurrences represent 105 minutes.
Available time = 450 – 105 = 345 minutes
Availability is:
Availability = 345 ÷ 450 = 76.7%
Calculating Performance
During the 345 available minutes, 1,000 parts were produced.
Considering a reference cycle time of 20 seconds per part:
Productive time = 1,000 × 20 seconds = 20,000 seconds
Performance is therefore:
Performance = 20,000 ÷ (345 × 60) = 96.6%
Although the equipment was available for 345 minutes, there were minor performance losses that prevented this entire period from being used at the reference speed.
Calculating Quality
Of the 1,000 parts produced, 55 have defects. There are therefore 945 conforming parts.
The time corresponding to conforming output is:
945 × 20 seconds = 18,900 seconds
Quality is therefore:
Quality = 18,900 ÷ 20,000 = 94.5%
Calculating OEE
With the three components calculated:
- Availability = 76.7%
- Performance = 96.6%
- Quality = 94.5%
We have:
OEE = 0.767 × 0.966 × 0.945 ≈ 70%
There is also an equivalent way to arrive directly at the same result:
OEE = (Number of conforming parts × Cycle time) ÷ Opening time
In this example:
OEE = (945 × 20) ÷ (450 × 60) = 70%
The advantage of breaking OEE down into Availability, Performance, and Quality is that it makes it possible to identify where losses come from and, consequently, where to focus improvement actions.
The six big losses of OEE
A common way to structure OEE analysis is through the six big losses, grouped according to the indicator’s three components:
- Availability
- Unplanned stoppages, such as equipment failures and breakdowns.
- Planned stoppages, such as setups, part number changes, and adjustments.
- Performance
- Minor stoppages and microstoppages, which repeatedly interrupt the process.
- Slow cycles, when the equipment operates below the reference speed or cycle time.
- Quality
- Production rejects, associated with defects, scrap, or rework.
- Startup rejects, related to stabilizing the process after a startup, changeover, or adjustment.
This classification makes it possible to move from an aggregate indicator to an operational view of losses. Instead of simply concluding that OEE is 70%, for example, the team can understand where the remaining potential was lost: in breakdowns, setups, microstoppages, speed reductions, defects, or startup losses. It is this breakdown that makes OEE truly useful for continuous improvement, because it helps identify which losses should be tackled first.
Reduce losses and increase production capacity in the automotive industry
How to monitor OEE and identify the causes of losses
An OEE monitoring system should do more than simply display a percentage on a dashboard. Its main purpose should be to provide information detailed enough to trigger action.
OEE data collection
Effective data collection requires clear rules.
Teams should know, for example, when a stoppage starts and ends, how to classify different types of losses, what the reference cycle time is, and which rules are used to determine opening time.
Without this standardization, two shifts or two plants may calculate the same indicator in different ways.
The first requirement for a robust OEE system is therefore consistency of information.
Monitoring stoppages and downtime
Stoppage monitoring should make it possible to analyze both unplanned downtime and the different causes of unavailability.
It is not enough to know the total number of minutes stopped. It is important to distinguish between breakdowns, setups, waiting, adjustments, material shortages, and other occurrences relevant to the process.
It is also useful to analyze duration and frequency simultaneously.
A rare but long loss and a short loss that occurs dozens of times per shift may represent similar total times, but they require different solutions.
Real-time OEE
Real-time OEE monitoring can speed up the identification of deviations and enable teams to respond more quickly.
However, digitizing data collection, or even using AI in the automotive industry to analyze stoppage patterns, does not eliminate the need for standards.
An automated system can record with high precision when a machine stops, but it is still necessary to correctly determine the cause of the stoppage and ensure that this classification is useful for management.
The value of real-time monitoring lies not only in obtaining data faster, but in making problems visible at a time when it is still possible to act on them.
From the OEE value to cause analysis
OEE should be used as a starting point for problem-solving, not as an end in itself.
Once a significant loss has been identified, the team should look for its root cause and define countermeasures.
This analysis can be integrated into daily management routines, using shift data to identify deviations, prioritize problems, and track improvement actions. Simpler problems can be solved in these daily routines, while more complex ones, with several possible causes or involving different areas, should be analyzed in multidisciplinary workshops.
How to improve OEE in the automotive industry
Improving OEE means acting on the losses that limit the effective use of existing capacity.
Priorities should be set based on facts: which losses are most significant, where they occur, and which have the greatest impact on production flow.
Reducing breakdowns and unplanned stoppages
When breakdowns account for a significant share of availability losses, action is needed on both preventing and resolving recurring causes.
Autonomous and planned maintenance practices can help increase equipment stability, while structured problem-solving helps eliminate recurring failures.
The goal is not only to repair faster, but also to reduce the likelihood of recurrence.
Reducing setup and changeover times
In environments with a high variety of part numbers, changeover time can consume a significant portion of available time.
Methodologies such as SMED (Single-Minute Exchange of Die) help analyze each setup activity in detail, separate internal and external tasks, simplify operations, and reduce the time needed to complete the changeover.
Reducing changeover times increases flexibility and frees up more capacity for production.
Eliminating microstoppages and speed losses
Microstoppages tend to be less visible than breakdowns, but they can represent a significant cumulative loss.
It is important to identify patterns: at which station they occur, on which product, how often, and for what causes.
Standardizing work, improving equipment, and eliminating recurring causes can help bring the actual cycle closer to the expected cycle time.
Reducing defects and rework
Quality must be built into the process, not just checked at the end.
Clear standards, error-proofing mechanisms, early detection of anomalies, and structured resolution of defect causes help reduce quality losses.
From an OEE perspective, every rejected unit represents productive time that was not converted into conforming product.
Improving bottlenecks and increasing production capacity
Not all equipment has the same impact on the plant’s overall performance.
Improving the OEE of a machine with excess capacity may have little effect on total output. Conversely, eliminating losses at production bottlenecks can translate directly into greater production capacity.
For this reason, OEE analysis should be framed within the overall production flow, as part of a broader discrete manufacturing optimization strategy.
The question should not only be “Where is OEE low?” but also “Which losses are limiting process capacity and customer service?”
OEE best practices: how to implement and improve the indicator
To be effective, OEE implementation requires more than simply installing a measurement system.
It is important to start with common definitions of opening time, stoppages, microstoppages, conforming output, and cycle times. Loss categories should be detailed enough to support analysis, but simple enough for teams to use consistently.
It is also advisable to initially focus the analysis on critical processes and equipment. The data should then become part of management routines. Daily analysis of the main losses makes it possible to turn OEE into a continuous improvement mechanism: identify the gap, understand the cause, define an action, verify the result, and update the standards when necessary.
Another important principle is to avoid turning OEE into an isolated target. Artificially increasing the indicator by changing calculation conventions does not generate more productivity. The goal is to use the indicator to improve the performance of the production system.
Implement OEE consistently and turn it into continuous improvement
OEE in the automotive industry: from measurement to continuous improvement
The real value of OEE does not lie in the percentage shown at the end of the calculation. It lies in its ability to make visible the losses that prevent a piece of equipment or a line from converting available time into conforming output.
By breaking down the result into Availability, Performance, and Quality, teams can distinguish very different problems that would otherwise remain hidden in a single productivity indicator.
In the automotive industry, this visibility makes it possible to act in a structured way on breakdowns, setups, microstoppages, speed losses, defects, and other sources of waste.
At Kaizen Institute, this approach integrates consistent data collection with daily management, structured problem-solving, and continuous improvement. In this way, OEE is no longer just a reporting indicator but is turned into concrete action on the main process losses, with a direct impact on operational performance.
The principle is simple: measure to understand losses, understand to set priorities, and improve to convert a greater share of available time into added value. This same logic underpins the Kaizen Institute approach to automotive industry consulting: using measurement as the starting point for continuous improvement that is reflected in concrete results in day-to-day operations.
Still have some questions about OEE?
What should a plant’s reference OEE value be?
There is no universal value suitable for all processes. More important than comparing OEE against a generic benchmark is ensuring that the calculation is consistent over time and using the indicator’s evolution to identify losses and track improvements.
Does it make sense to compare OEE across different lines or plants?
Yes, but only when the calculation rules are equivalent. Differences in how opening time is defined, how stoppages are classified, or in the reference cycle time can make the comparison unreliable. Before comparing results, it is essential to standardize the measurement criteria.
What technologies can be used to measure OEE?
OEE can be calculated from manual records, Manufacturing Execution Systems (MES), data from Programmable Logic Controllers (PLCs) and sensors connected to equipment, or dedicated monitoring platforms. The higher the level of automation, the faster and more granular the data tends to be. However, technology only adds value when there are clear criteria for classifying stoppages, defining cycle times, and correctly interpreting the causes of losses.
See more on Automotive
Find out more about transformation in this sector