
Benchmarks & Case Studies
Reduction of Weight Deviations in the Industrial Production of Cookies


In a high-volume production environment, it is particularly important to ensure that key process parameters and variables are within the compliance limits. With some frequency, process adjustments and changes are required to make the product suitable for consumption, fit the packaging, or meet quality requirements. In most cases, problems are not caused by a single factor. They are the result of interactions between several factors, including ingredient composition, equipment settings and other processing conditions such as plant temperature.
The Company
A cookie producer for several decades, the company in question combines tradition and rigor with a focus on innovation as a formula for success for its long-term growth.
In this context, the continuous improvement project began after an end-to-end analysis of the value chain where several opportunities for improvement were identified in different stages of the process. Ultimately, to improve the overall performance of the company, the main goals were defined as follows: reduction of waste, optimization of equipment efficiency and cultural change throughout the organization.
The Challenge
This success case addresses one of the problems identified: the variability and overweight of cookie packages. Since the final products are sold to consumers in packages of declared weight, the weight of a package must not fall below a minimum value.
With difficulties in stabilizing the weight of the packages, the company’s strategy has always been to produce above the nominal value, which naturally has an impact on the company’s profit. When a package is produced with a higher weight, two situations can occur:
a) the product is shipped to the customer.
b) the package is rejected by the weight-controlling machine and the product is reintroduced into the production line.
For case a), the company only incurs the cost of the excess raw material, while in situation b) the cost of rework – labor and energy – and the extra wrapper that is wasted is accounted for. In cases of lack of production capacity, the loss of efficiency – measured by the amount of marketable product at a given moment – represents a loss of revenue for the company or a cost associated with overtime work.
Line F was selected as a pilot for the project because it is representative of the problem. The main goal defined was a 3% reduction in excess weight for a given product with a nominal weight of 200g. The excess weight of the pilot product represented 1.97% of the total production cost.
The Approach
After choosing the pilot line, we began the process analysis, identifying the operations and specifications. This analysis was supported by data collection and field observations, using the Lean Six Sigma methodology.
Thereafter, in a root cause analysis, the potential origins of the problem were discussed, organized by category into a Fishbone Diagram.
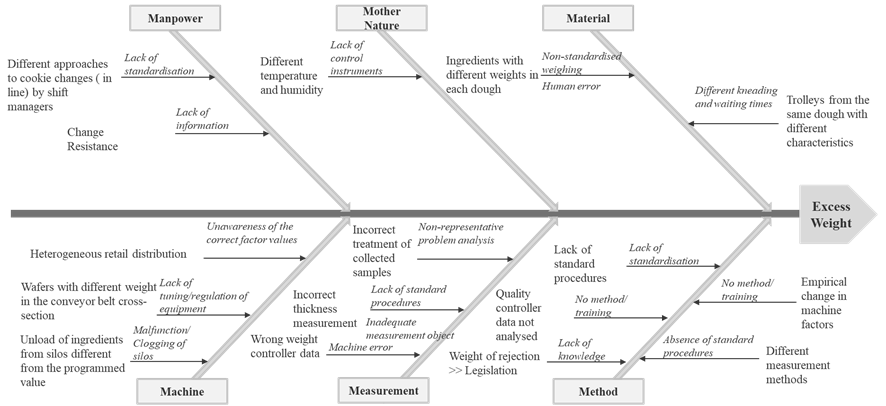
Cause-Effect Diagram
A relationship diagram was drawn up, identifying the connections between the process variables, such as, for example, the kneading time, the calibration of the laminators and the flour batch. Subsequently, as a team, the variables that would allow for more significant results were selected through an F-VMEA, and a design of experiments (DOE) was performed, allowing variation in the levels of the factors and observation of the respective changes in the weight of the package.
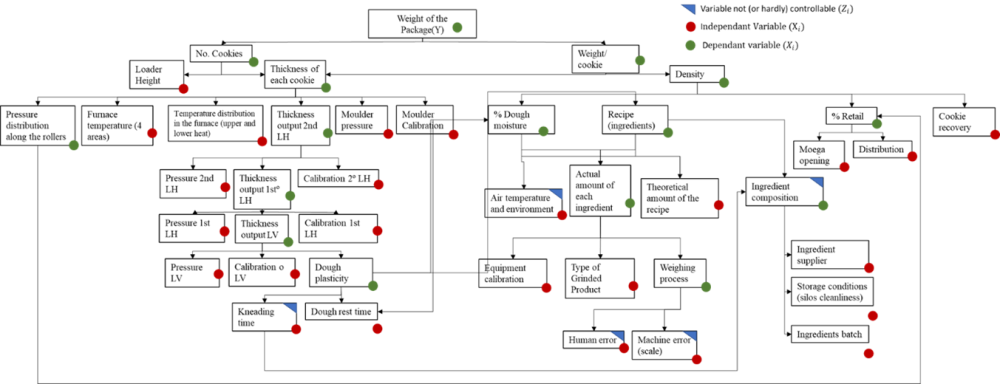
Relationship diagram of the factors involved in excess weight
To eliminate the critical causes, an action plan was drawn up in parallel to implement the identified improvements. These included changes in the weighing process, standardization of the dough excess percentage range*, revision of the quantity of ammonium bicarbonate, adjustments to the kneading and dough resting times, standardization of the equipment parameters, and improvements to the quality control method.
Given the success of the actions, we moved on to training and communication, which proved to be crucial for behavioral change and clarification of the reasons for adopting the new procedures.
Results
The 3% reduction target was achieved with a 6% reduction in overweight. There was also a 75% reduction in the cost of non-quality.
Through control charts, it was concluded that the process is stable and focused, being under statistical control, and is very close to having the capacity to produce packages within the minimum specifications initially defined by the company.
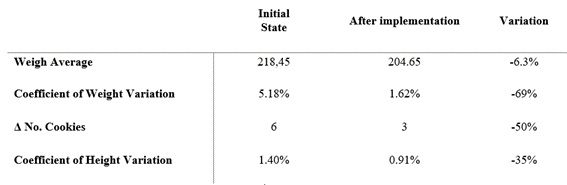
Results Table
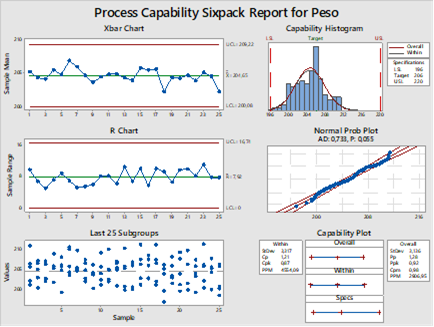
Control chart x ?-R and capacity analysis for package weight
The results obtained correspond to savings of around 50 thousand euros per year for the pilot line. After deployment throughout the plant, the estimated benefit is 225,000 euros per year.
Conclusion
The results obtained prove the effectiveness of the Lean Six Sigma methodology as a key tool in the search for better operational performance, rewarding all the effort invested in fighting waste and seeking excellence.
With a view to future application, a new measurement system was designed to evaluate product weight, thickness, and color, as well as a model that reflects the continuous improvement cycle through analysis of process stability and capacity.
*The dough excess is the exceeding dough from the cookie cutting process.
#processmanufacturing #quality
See more on Process Manufacturing
Find out more about transformation in this sector
See more on Quality
Find out more about improving this business area